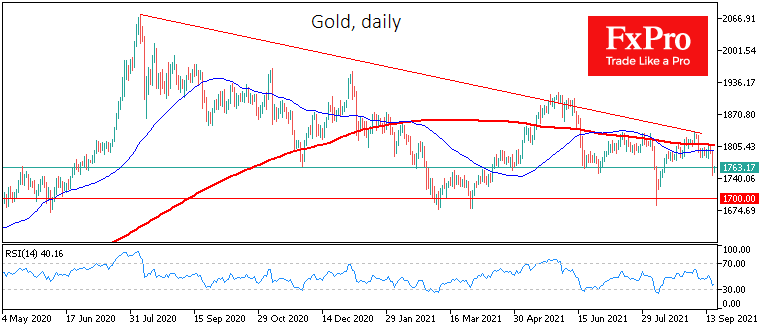
Strong US data revived bets on an imminent QE rollback from the Fed, supporting the dollar and causing bond yields to rise. The news triggered a more than 2% plunge in gold prices, four times the amplitude of the dollar’s rise against a basket of major currencies.

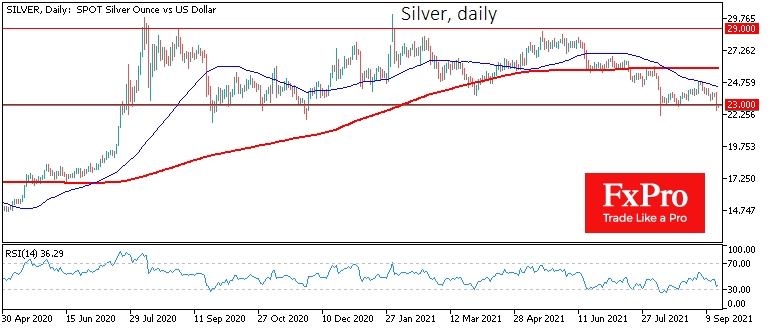
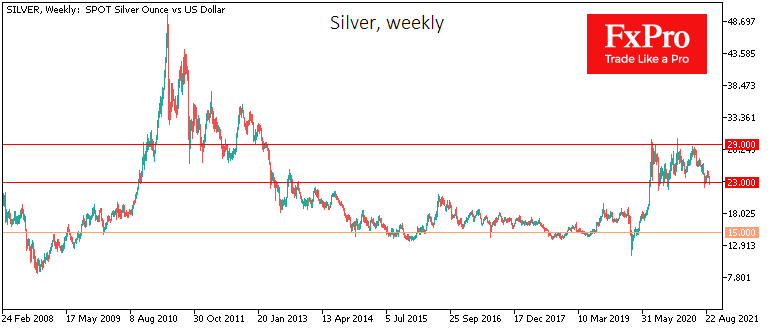
Silver plunged from levels near $24 at one point to $22.6, more than 5.5%, at the lower end of its trading range since last July. Despite the larger drop from the peak (-23%), Silver has been moving sideways all this time, fluctuating widely between $29 and $23.
Gold’s pullback from the highs is less intense in percentage terms (only 15%), but a downtrend has formed on the chart here with a sequence of lower peaks as the bears take control from lower levels.
The downtrend in Gold is supporting by solid US data pushing the moment of the Fed’s key rate hike ever closer.
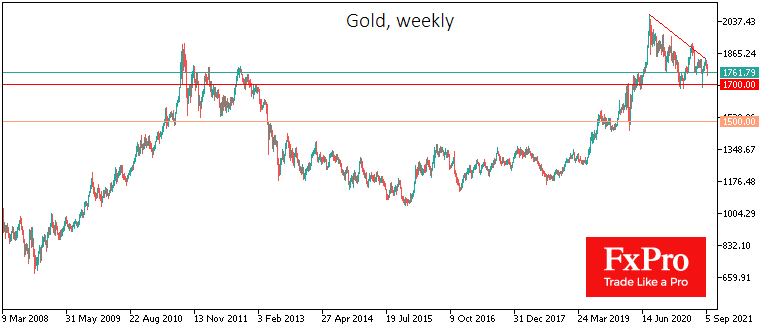
Fundamentally, the current situation replicates 2014 when the FOMC was similarly on the verge of winding down balance sheet purchases. By the first public hints of Fed plans in April 2013, Gold had already sold off for six months. Subsequently, the price of Gold fell for another two and a half years, right up to the date of the Fed’s key rate hike.
Learning from the only historical example, the downtrend in Gold could continue for another year or so, based on the current rate projections. Potentially, it may come under the fiercest selling pressure during a period of reduced asset purchases for the Fed’s balance sheet.
From current levels near $1760/oz, gold investors should look to the price dynamic near the $1700 area, which has acted as support since February. A bull’s capitulation from these levels promises to pave the way for a rapid decline towards $1500.
For Silver, a sustained drop below $23 could mean a move into active selling, returning the price to the previous consolidation area around $15 before the end of the year, half the peak of February.
The FxPro Analyst Team