Categories: Technical analysis

General Motors Wave Analysis – 23 February 2023

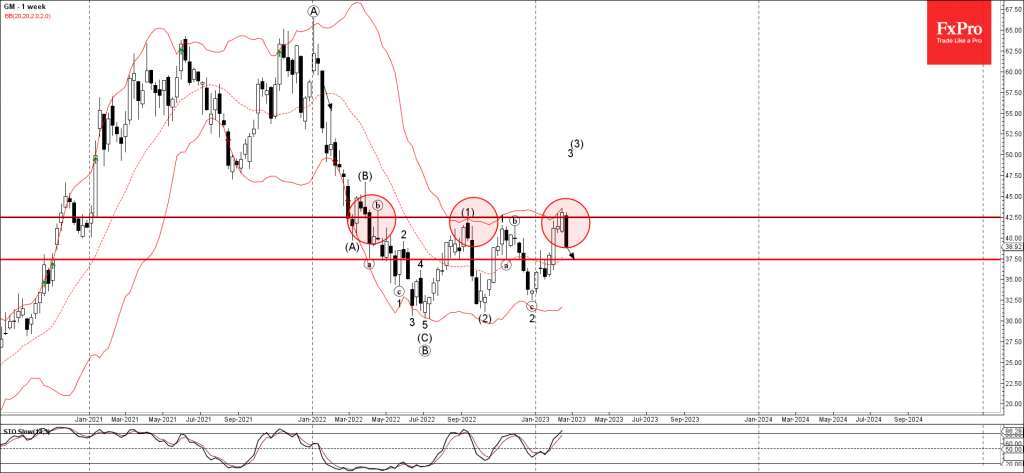
• General Motors reversed from key resistance level 42.500

• Likely to fall to support level 37.50

General Motors recently reversed down from the key resistance level 42.500 (which has been reversing the price from the start of 2022) intersecting with the upper weekly Bollinger Band.

The downward reversal from the resistance level 42.500 will most likely form the weekly Bearish Engulfing – bearish signal for General Motors.

Given the still overbought weekly Stochastic, General Motors can be expected to fall further toward the next support level 37.50.

The FxPro Tech Analysis Team

The FxPro technical experts prepare a daily analysis of the most active currency pairs (majors, crosses, exotics) and commodities. Selected instruments are reviewed on daily trends (D1, H4), using the active Elliott Wave setups, Japanese candlesticks, indicators, and support/resistance levels.

Share
Published by
The FxPro Tech Analysis Team

Recent Posts

Nat Gas Current situation #tradelikeapro #trading #natgas #tradingstrategy #tradingshorts

Today is Tuesday, the 13th of January, and we will talk about the natural gas…

1 hour ago

Bitcoin Cash Wave Analysis – 12 January 2026

Bitcoin Cash: ⬇️ Sell - Bitcoin Cash reversed from resistance area - Likely to fall…

11 hours ago

EURJPY Wave Analysis – 12 January 2026

EURJPY: ⬆️ Buy - EURJPY reversed from support area - Likely to rise to resistance…

11 hours ago

Gold shines on an anti-fiat thesis

The dollar suffered due to threats to the Fed’s independence. Gold managed to renew its…

21 hours ago

SP500 Current situation #trading #tradelikeapro #sp500 #tradingshorts #tradingstrategy

Today is Monday, the 12th of January, and once again we will talk about the…

21 hours ago

Crypto: sell-the-growth continues

Crypto markets remain volatile; Bitcoin faces selling pressure, XRP slips, Monero surges, and market signals…

22 hours ago

This website uses cookies