Categories: Technical analysis

General Motors Wave Analysis – 18 March, 2020

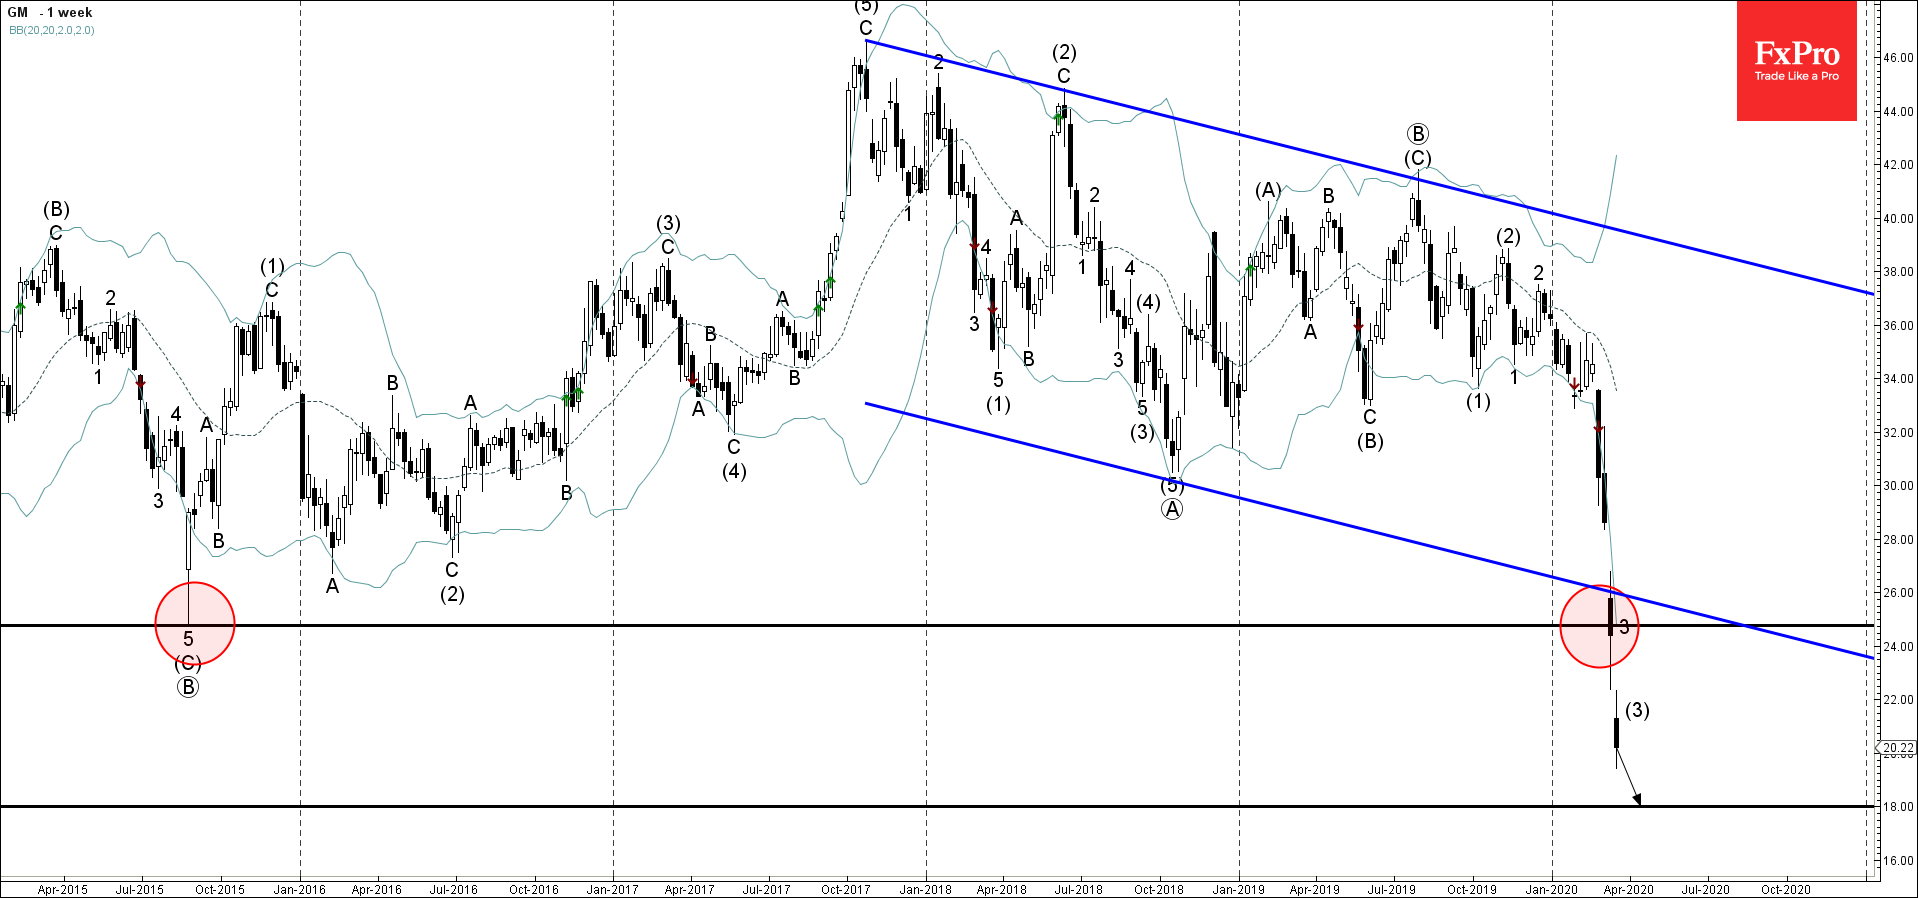
  • General Motors falling inside impulse waves 3 and (3).
  • Likely to fall to 18.00 and 15.00

General Motors has been under bearish pressure lately following the earlier breakout of the key support level 24.75 (former multi-month low from 2015).

The breakout of the support level 24.75 was preceded by the breakout of the wide weekly down channel from 2017 – which accelerated the active impulse waves 3 and (3).

General Motors is likely to fall further toward the next support level 18.00 – the breakout of which can lead to further losses toward 15,00.

The FxPro Tech Analysis Team

The FxPro technical experts prepare a daily analysis of the most active currency pairs (majors, crosses, exotics) and commodities. Selected instruments are reviewed on daily trends (D1, H4), using the active Elliott Wave setups, Japanese candlesticks, indicators, and support/resistance levels.

Share
Published by
The FxPro Tech Analysis Team
Tags: GM

Recent Posts

S&P 500 Wave Analysis – 1 April 2025

S&P 500: ⬆️ Buy - S&P 500 reversed from support area - Likely to rise…

6 hours ago

GBPAUD Wave Analysis – 1 April 2025

GBPAUD: ⬇️ Sell - GBPAUD reversed from long-term resistance level 2.0820 - Likely to fall…

6 hours ago

Crypto’s Attempt to Stabilise

The cryptocurrency market has experienced some volatility, with a 1.1% rise in 24 hours and…

18 hours ago

NIO Wave Analysis – 31 March 2025

NIO: ⬆️ Buy - NIO reversed from support zone - Likely to rise to resistance…

1 day ago

Nvidia Wave Analysis – 31 March 2025

Nvidia: ⬆️ Buy - Nvidia reversed from key support level 105.00 - Likely to rise…

1 day ago

Markets rattled on consumer sentiment

Consumer sentiment index from the University of Michigan shows alarming information for stock indices, with…

2 days ago