Categories: Technical analysis

General Electric Wave Analysis – 5 January, 2023

• General Electric broke resistance level 68.75

• Likely to rise to resistance level 74.75


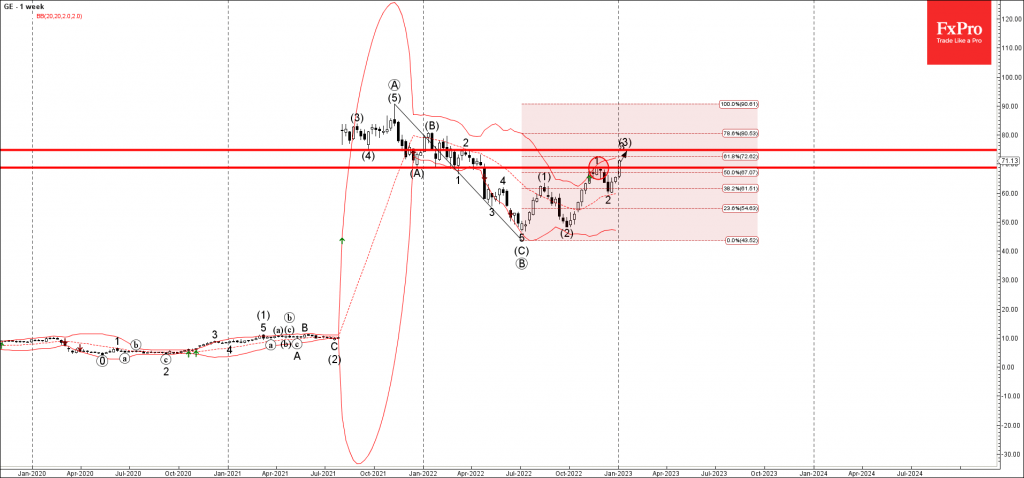
General Electric recently broke above the key resistance level 68.75 (which stopped the previous sharp upward impulse wave 1 at the end of 2022), intersecting with the 50% Fibonacci correction of the downward correction from the end of 2021.

The breakout of the resistance level 68.75 accelerated the active impulse wave 3, which belongs to the weekly upward impulse sequence (3) from last October.

General Electric can be expected to rise further toward the next resistance level 74.75 (top of the wave 2 from the start of 2022 and the forecast price for the completion of the active impulse 3).

AddThis Website Tools
The FxPro Tech Analysis Team

The FxPro technical experts prepare a daily analysis of the most active currency pairs (majors, crosses, exotics) and commodities. Selected instruments are reviewed on daily trends (D1, H4), using the active Elliott Wave setups, Japanese candlesticks, indicators, and support/resistance levels.

Share
Published by
The FxPro Tech Analysis Team

Recent Posts

S&P 500 Wave Analysis – 1 April 2025

S&P 500: ⬆️ Buy - S&P 500 reversed from support area - Likely to rise…

7 hours ago

GBPAUD Wave Analysis – 1 April 2025

GBPAUD: ⬇️ Sell - GBPAUD reversed from long-term resistance level 2.0820 - Likely to fall…

7 hours ago

Crypto’s Attempt to Stabilise

The cryptocurrency market has experienced some volatility, with a 1.1% rise in 24 hours and…

19 hours ago

NIO Wave Analysis – 31 March 2025

NIO: ⬆️ Buy - NIO reversed from support zone - Likely to rise to resistance…

1 day ago

Nvidia Wave Analysis – 31 March 2025

Nvidia: ⬆️ Buy - Nvidia reversed from key support level 105.00 - Likely to rise…

1 day ago

Markets rattled on consumer sentiment

Consumer sentiment index from the University of Michigan shows alarming information for stock indices, with…

2 days ago