Categories: Technical analysis

General Electric Wave Analysis – 17 March, 2020

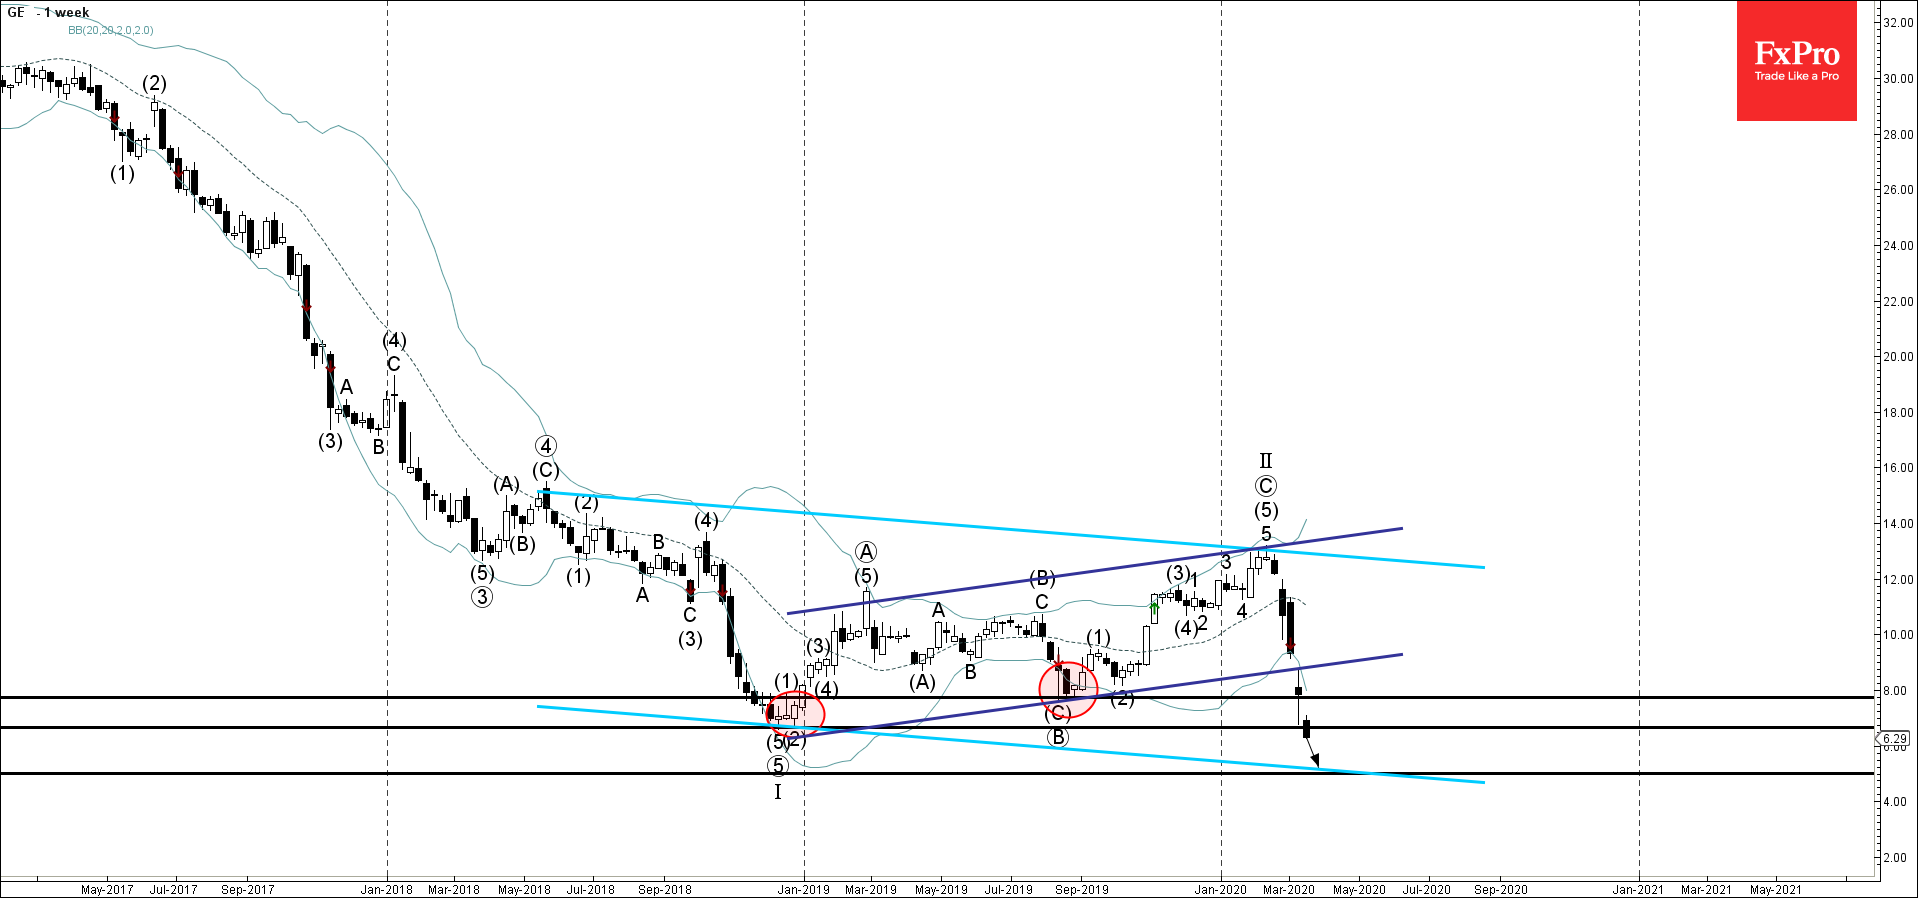
  • General Electric broke support zone
  • Likely to fall to 5.00

General Electric recently broke through the support zone lying between the the long-term support level 7.72 (yearly low from 2019) and 6.65 (which stopped the sharp downtrend at the end of 2018).

Both of the above support breakouts are very strong sell signals which heighten the probability of further losses for General Electric.

Given the strength of the long-term downtrend that can be seen on the weekly General Electric charts – the price is likely to fall further toward the next support level 5.00 (intersecting with the weekly down channel from 2018).

The FxPro Tech Analysis Team

The FxPro technical experts prepare a daily analysis of the most active currency pairs (majors, crosses, exotics) and commodities. Selected instruments are reviewed on daily trends (D1, H4), using the active Elliott Wave setups, Japanese candlesticks, indicators, and support/resistance levels.

Share
Published by
The FxPro Tech Analysis Team
Tags: GE

Recent Posts

AUDJPY Wave Analysis – 5 December 2025

AUDJPY: ⬆️ Buy - AUDJPY broke long-term resistance level 102.30 - Likely to rise to…

7 hours ago

Aptos Wave Analysis – 5 December 2025

Aptos: ⬇️ Sell - Aptos testing major support at 1.688 - Likely to fall to…

7 hours ago

Pro News Weekly: Market Shake-Up, Dollar Drops, Gold Surges, Bitcoin Wobbles!

Welcome to Pro News Flash! 💵 The U.S. dollar slips 🏆 Major stock indices struggle…

13 hours ago

Solana Wave Analysis – 5 December 2025

Solana: ⬇️ Sell - Solana reversed from resistance zone - Likely to fall to support…

14 hours ago

EURAUD Wave Analysis – 5 December 2025

EURAUD : ⬇️ Sell - EURAUD broke the support level 1.7600 - Likely to fall…

14 hours ago

Forex has set its priorities

In 2026, experts favour the yen, see modest euro growth, and expect pressure on the…

18 hours ago

This website uses cookies