Categories: Technical analysis

GBPUSD Wave Analysis 9 July 2024

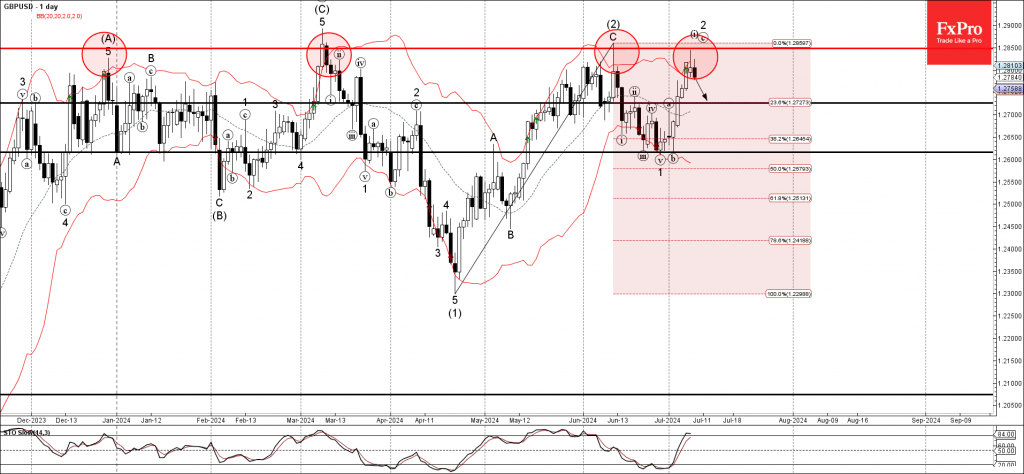
– GBPUSD reversed from the long-term resistance level 1.2850

– Likely to fall to support level 1.2725

GBPUSD currency pair is under bearish pressure after the earlier downward reversal from the long-term resistance level 1.2850, which has been reversing the price from the start of March.

The downward reversal from the resistance level 1.2850 created the daily Japanese candlesticks reversal pattern Shooting Star Doji – which stopped the previous ABC correction 2.

Given the strength of the resistance level 1.2850 and the still overbought daily Stochastic, GBPUSD currency pair can be expected to fall further to the next support level 1.2725.

The FxPro Tech Analysis Team

The FxPro technical experts prepare a daily analysis of the most active currency pairs (majors, crosses, exotics) and commodities. Selected instruments are reviewed on daily trends (D1, H4), using the active Elliott Wave setups, Japanese candlesticks, indicators, and support/resistance levels.

Share
Published by
The FxPro Tech Analysis Team
Tags: GBPUSD

Recent Posts

CHFJPY Wave Analysis – 9 January 2026

CHFJPY: ⬆️ Buy - CHFJPY reversed from support area - Likely to rise to resistance…

2 days ago

Exxon Mobil Wave Analysis – 9 January 2026

Exxon Mobil: ⬆️ Buy - Exxon Mobil reversed from support area - Likely to rise…

2 days ago

Pro News Weekly: Dollar Rebounds as Markets Test New Limits

Welcome to Pro News Weekly! Here’s what is shaping the markets: 💵 The U.S. dollar…

3 days ago

Geopolitics will destroy the euro

•    EURUSD falls due to geopolitics and expectations of tariff removal •    Gold returns to…

3 days ago

Platinum Wave Analysis – 8 January 2026

Platinum: ⬇️ Sell - Platinum reversed from pivotal resistance level 150.00 - Likely to fall to…

3 days ago

Baidu Wave Analysis – 8 January 2026

Baidu: ⬇️ Sell - Baidu reversed from resistance zone - Likely to fall to support level…

3 days ago

This website uses cookies