Categories: Technical analysis

GBPUSD Wave Analysis – 8 November, 2021

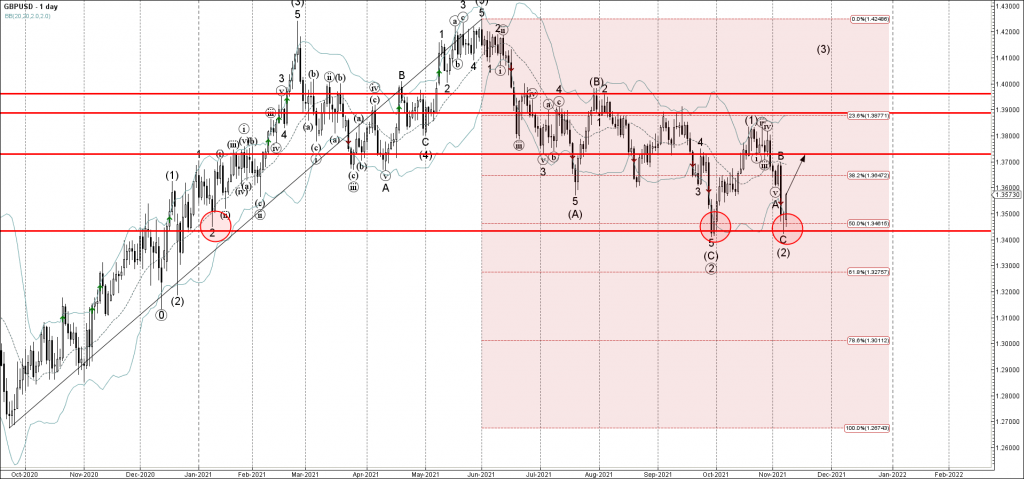
• GBPUSD reversed from support level 1.3430

• Likely to rise to resistance level 1.3700                                                                  


GBPUSD currency pair continues to rise after the price reversed up from the key support level 1.3430 (pervious monthly low from September), intersecting with the 50% Fibonacci correction of the previous upward impulse from 2020 and the lower daily Bollinger band.

The upward reversal from the support level 1.3430 created the daily candlesticks reversal pattern Hammer.

Given the strength of the support level 1.3430, GBPUSD currency pair can be expected to rise further toward the next resistance level 1.3700 (top of the earlier wave B).

The FxPro Tech Analysis Team

The FxPro technical experts prepare a daily analysis of the most active currency pairs (majors, crosses, exotics) and commodities. Selected instruments are reviewed on daily trends (D1, H4), using the active Elliott Wave setups, Japanese candlesticks, indicators, and support/resistance levels.

Share
Published by
The FxPro Tech Analysis Team
Tags: GBPUSD

Recent Posts

USDJPY Wave Analysis 26 April 2024

- USDJPY broke key resistance level 155.00 - Likely to rise to resistance level 160.00…

1 day ago

Ebay Wave Analysis 26 April 2024

- Ebay reversed from support level 49.35 - Likely to rise to resistance level 52.55…

1 day ago

False Alert with Yen Interventions?

Even though the Bank of Japan left the key rate and parameters of the QE…

2 days ago

Cooler Bitcoin

Market picture  Market Dynamics: The cryptocurrency market stabilised, losing just 0.1% of capitalisation and dropping to…

2 days ago

GBPCAD Wave Analysis 25 April 2024

- GBPCAD reversed from key support level 1.6910 - Likely to rise to resistance level…

2 days ago

GBPAUD Wave Analysis 25 April 2024

- GBPAUD reversed from support level 1.9135 - Likely to rise to resistance level 1.9360…

2 days ago

This website uses cookies