Categories: Technical analysis

GBPUSD Wave Analysis 7 November 2024

– GBPUSD reversed from support level 1.2840

– Likely to rise to resistance level 1.3050

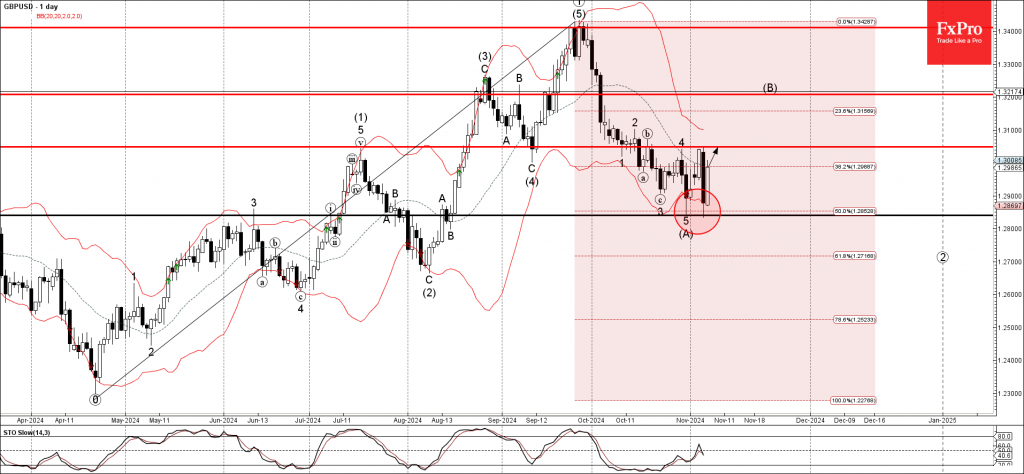
GBPUSD currency pair recently reversed up from the support level 1.2840 (which stopped the previous intermediate correction (A) at the end of October).

The upward reversal from the support level 1.2840 created the daily Japanese candlesticks reversal pattern Piercing Line.

Given the clear daily uptrend and the strong US dollar sales seen today, GBPUSD currency pair can be expected to rise to the next resistance level 1.3050 (top of the previous minor correction 4).

AddThis Website Tools
The FxPro Tech Analysis Team

The FxPro technical experts prepare a daily analysis of the most active currency pairs (majors, crosses, exotics) and commodities. Selected instruments are reviewed on daily trends (D1, H4), using the active Elliott Wave setups, Japanese candlesticks, indicators, and support/resistance levels.

Share
Published by
The FxPro Tech Analysis Team
Tags: GBPUSD

Recent Posts

CADJPY Wave Analysis – 23 April 2025

CADJPY: ⬆️ Buy - CADJPY reversed from strong support area - Likely to rise to…

1 hour ago

USDJPY Wave Analysis – 23 April 2025

USDJPY: ⬆️ Buy - USDJPY reversed from the support area - Likely to rise to…

1 hour ago

Europe’s Growth Stalls Again as the Euro Enters Correction Mode

Eurozone business activity slows as falling orders and declining confidence impact growth. Manufacturing PMI remains…

7 hours ago

The Rapid Assault on Crypto

The cryptocurrency market experienced a significant surge, with market capitalisation reaching $2.95 trillion. Bitcoin is…

10 hours ago

Bitcoin Wave Analysis – 22 April 2025

Bitcoin: ⬆️ Buy - Bitcoin broke round resistance level 90000.00 - Likely to rise to…

1 day ago

AUDUSD Wave Analysis – 22 April 2025

AUDUSD: ⬇️ Sell - AUDUSD reversed from the key resistance level 0.6400 - Likely to…

1 day ago