Categories: Technical analysis

GBPUSD Wave Analysis 7 December, 2020

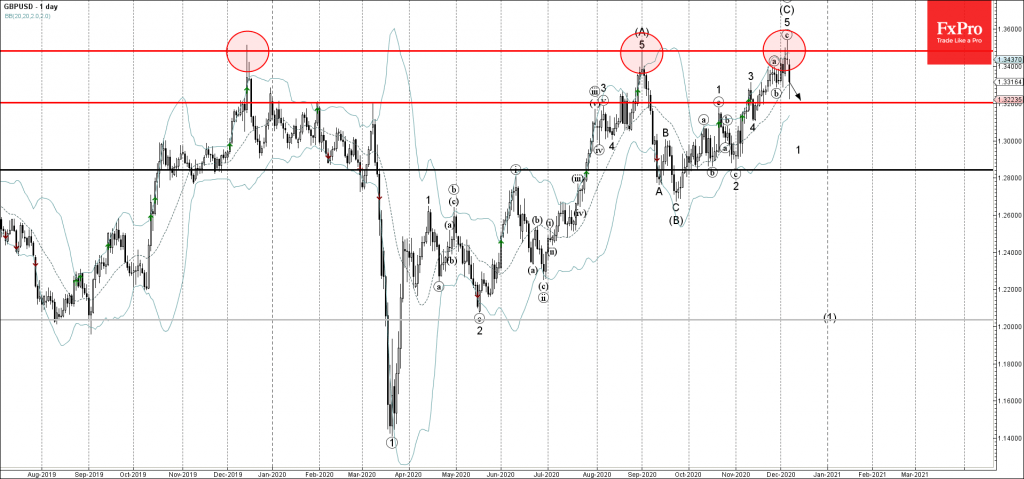
• GBPUSD reversed from powerful resistance level 1.3480

• Likely to fall to 1.3200

GBPUSD fell sharply today after the price reversed down from the powerful resistance level 1.3480 (which stopped the two previous uptrends – in December of 2019 and also in September of 2020), strengthened by the upper daily Bollinger Band.

The downward reversal from the resistance level 1.3480 created the daily Japanese candlesticks reversal pattern Shooting Star Doji.

Given the predominantly bearish sterling sentiment seen across the FX markets today – GBPUSD is expected to fall further toward the next support level 1.3200.

The FxPro Tech Analysis Team

The FxPro technical experts prepare a daily analysis of the most active currency pairs (majors, crosses, exotics) and commodities. Selected instruments are reviewed on daily trends (D1, H4), using the active Elliott Wave setups, Japanese candlesticks, indicators, and support/resistance levels.

Share
Published by
The FxPro Tech Analysis Team
Tags: GBPUSD

Recent Posts

Bitcoin Cash Wave Analysis – 12 January 2026

Bitcoin Cash: ⬇️ Sell - Bitcoin Cash reversed from resistance area - Likely to fall…

21 minutes ago

EURJPY Wave Analysis – 12 January 2026

EURJPY: ⬆️ Buy - EURJPY reversed from support area - Likely to rise to resistance…

23 minutes ago

Gold shines on an anti-fiat thesis

The dollar suffered due to threats to the Fed’s independence. Gold managed to renew its…

10 hours ago

SP500 Current situation #trading #tradelikeapro #sp500 #tradingshorts #tradingstrategy

Today is Monday, the 12th of January, and once again we will talk about the…

11 hours ago

Crypto: sell-the-growth continues

Crypto markets remain volatile; Bitcoin faces selling pressure, XRP slips, Monero surges, and market signals…

12 hours ago

CHFJPY Wave Analysis – 9 January 2026

CHFJPY: ⬆️ Buy - CHFJPY reversed from support area - Likely to rise to resistance…

3 days ago

This website uses cookies