Categories: Technical analysis

GBPUSD Wave Analysis 5 July 2024

– GBPUSD rising inside wave 2

– Likely to rise to resistance level 1.2850

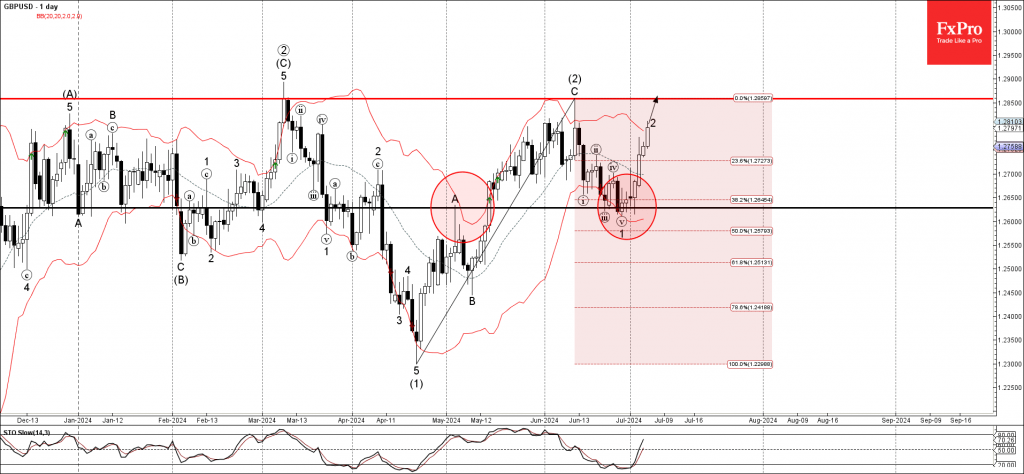
GBPUSD currency pair recently reversed up from the key support level 1.2630 (which also stopped the earlier impulse ii at the end of June).

The support level 1.2630 was strengthened by the lower daily Bollinger Band and by the 38.2% Fibonacci correction of the previous sharp ABC correction (2) from April.

Given the bearish USD sentiment seen today, GBPUSD currency pair can be expected to rise to the resistance level 1.2850 (which stopped the previous correction (2)).

The FxPro Tech Analysis Team

The FxPro technical experts prepare a daily analysis of the most active currency pairs (majors, crosses, exotics) and commodities. Selected instruments are reviewed on daily trends (D1, H4), using the active Elliott Wave setups, Japanese candlesticks, indicators, and support/resistance levels.

Share
Published by
The FxPro Tech Analysis Team
Tags: GBPUSD

Recent Posts

Natural Gas Wave Analysis 4 October 2024

- Natural gas reversed from long-term resistance level 3.150 - Likely to fall to support…

8 hours ago

S&P 500 Wave Analysis 4 October 2024

- S&P 500 reversed from support level 5680.00 - Likely to rise to resistance level…

8 hours ago

The crypto market awaits news

The crypto market has significantly slowed its decline. Bitcoin remains just above its 50-day MA…

22 hours ago

EURAUD Wave Analysis 3 October 2024

EURAUD reversed from strong support level 1.6020 Likely to rise to resistance level 1.6260 EURAUD…

2 days ago

EURCAD Wave Analysis 3 October 2024

- EURCAD reversed from key support level 1.4900 - Likely to rise to resistance level…

2 days ago

Dollar Growth or Just a Rebound? NFP Holds the Key

The Dollar Index is rising for the fourth consecutive day, gaining over 1.7%, and is…

2 days ago

This website uses cookies