Categories: Technical analysis

GBPUSD Wave Analysis – 3 September, 2020

• GBPUSD reversed from long-term resistance level 1.3480

• Likely to fall to 1,3200

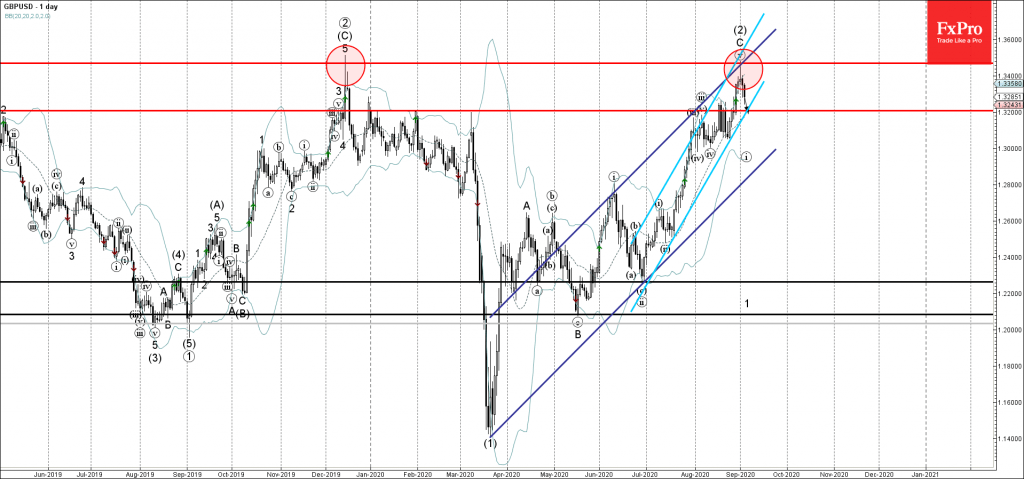
GBPUSD recently reversed down with the daily Shooting Star from the powerful long-term resistance level 1.3480 (which also stopped the strong daily uptrend in December of 2019).

The resistance zone surrounding the resistance level 1.3480 was further strengthened by the resistance trendlines of the two daily up channels from June and March.

GBPUSD is likely to fall further toward the next support level 1,3200 (former major resistance from March).

The FxPro Tech Analysis Team

The FxPro technical experts prepare a daily analysis of the most active currency pairs (majors, crosses, exotics) and commodities. Selected instruments are reviewed on daily trends (D1, H4), using the active Elliott Wave setups, Japanese candlesticks, indicators, and support/resistance levels.

Share
Published by
The FxPro Tech Analysis Team
Tags: GBPUSD

Recent Posts

Bitcoin Cash Wave Analysis – 12 January 2026

Bitcoin Cash: ⬇️ Sell - Bitcoin Cash reversed from resistance area - Likely to fall…

4 hours ago

EURJPY Wave Analysis – 12 January 2026

EURJPY: ⬆️ Buy - EURJPY reversed from support area - Likely to rise to resistance…

4 hours ago

Gold shines on an anti-fiat thesis

The dollar suffered due to threats to the Fed’s independence. Gold managed to renew its…

13 hours ago

SP500 Current situation #trading #tradelikeapro #sp500 #tradingshorts #tradingstrategy

Today is Monday, the 12th of January, and once again we will talk about the…

14 hours ago

Crypto: sell-the-growth continues

Crypto markets remain volatile; Bitcoin faces selling pressure, XRP slips, Monero surges, and market signals…

15 hours ago

CHFJPY Wave Analysis – 9 January 2026

CHFJPY: ⬆️ Buy - CHFJPY reversed from support area - Likely to rise to resistance…

3 days ago

This website uses cookies