Categories: Technical analysis

GBPUSD Wave Analysis – 3 November, 2022

• GBPUSD reversed from resistance area

• Likely to fall to support level 1.1200

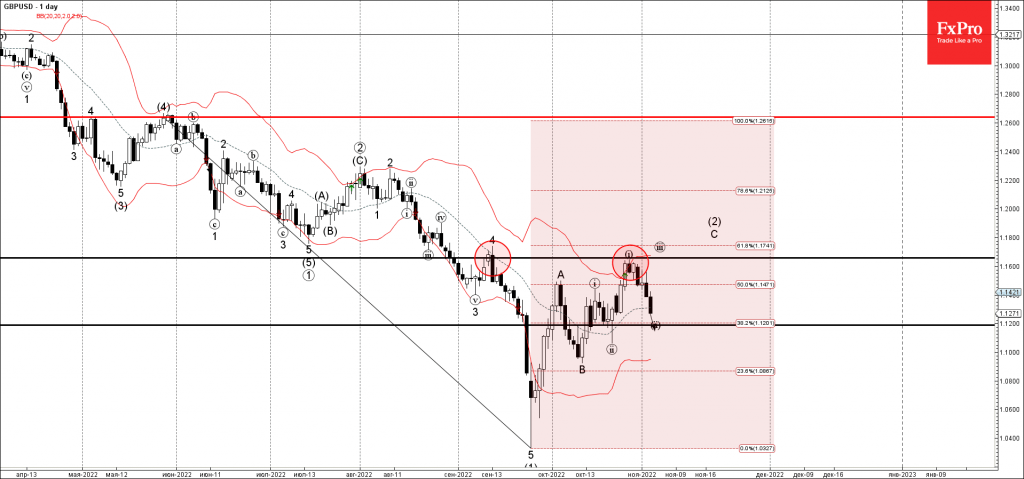
GBPUSD currency pair recently reversed down from the resistance area located between the pivotal resistance level 1.1660 (which stopped wave 4 in September), intersecting with the upper daily Bollinger Band and the 61.8% Fibonacci correction of the downward impulse from May.

The downward reversal from the resistance level 1.1660 started the active minor corrective wave (ii) which belongs to wave C from October.

Given the strong daily downtrend, GBPUSD can be expected to fall further toward the next support level 1.1200 (target for the completion of the active wave (ii)).

The FxPro Tech Analysis Team

The FxPro technical experts prepare a daily analysis of the most active currency pairs (majors, crosses, exotics) and commodities. Selected instruments are reviewed on daily trends (D1, H4), using the active Elliott Wave setups, Japanese candlesticks, indicators, and support/resistance levels.

Share
Published by
The FxPro Tech Analysis Team
Tags: GBPUSD

Recent Posts

Platinum Wave Analysis – 8 January 2026

Platinum: ⬇️ Sell - Platinum reversed from pivotal resistance level 150.00 - Likely to fall to…

8 hours ago

Baidu Wave Analysis – 8 January 2026

Baidu: ⬇️ Sell - Baidu reversed from resistance zone - Likely to fall to support level…

8 hours ago

EURUSD Wave Analysis – 8 January 2026

EURUSD: ⬇️ Sell - EURUSD broke daily up channel - Likely to fall to support…

10 hours ago

WTI crude oil Wave Analysis – 8 January 2026

WTI crude oil: ⬆️ Buy - WTI crude oil reversed from support zone - Likely…

10 hours ago

Do not underestimate dollar

Positive macro statistics for the US are helping the greenback. Gold could rise to $4,610…

17 hours ago

Crypto fails to find support for a breakout

Crypto markets fell amid caution; Bitcoin and Ethereum face technical and investor shifts, with privacy…

18 hours ago

This website uses cookies