Categories: Technical analysis

GBPUSD Wave Analysis 28 November 2024

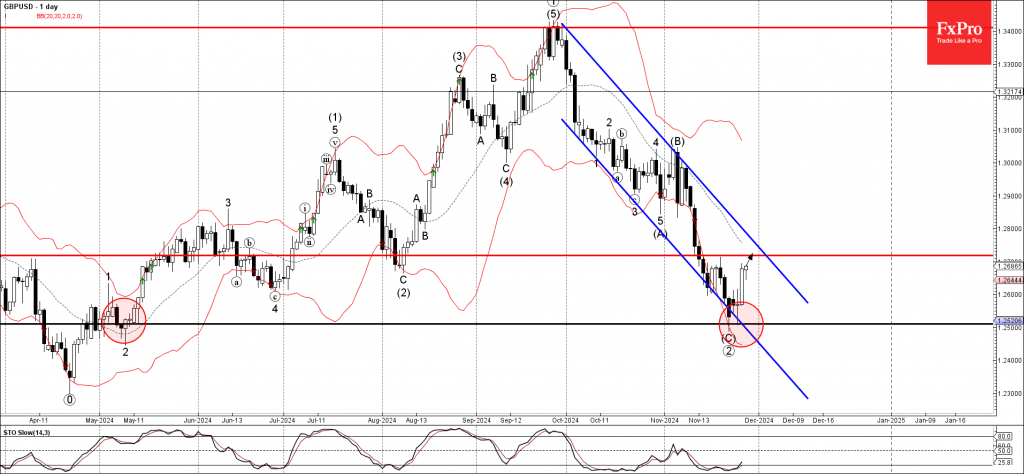
– GBPUSD reversed from support level 1.2500

– Likely to rise to resistance level 1.2720

GBPUSD currency pair continues to rise after the earlier upward reversal from the support level 1.2500 (which also reversed the pair in May) coinciding with the lower daily Bollinger Band and the daily down channel from September.

The upward reversal from the support level 1.2500 started the active intermediate impulse wave (1).

GBPUSD currency pair can be expected to rise to the next resistance level 1.2720 (former top of the minor correction from the middle of November).

The FxPro Tech Analysis Team

The FxPro technical experts prepare a daily analysis of the most active currency pairs (majors, crosses, exotics) and commodities. Selected instruments are reviewed on daily trends (D1, H4), using the active Elliott Wave setups, Japanese candlesticks, indicators, and support/resistance levels.

Share
Published by
The FxPro Tech Analysis Team
Tags: GBPUSD

Recent Posts

Solana Wave Analysis – 18 March 2025

Solana: ⬇️ Sell - Solana reversed from the resistance zone - Likely to fall to…

1 hour ago

CHFJPY Wave Analysis – 18 March 2025

CHFJPY: ⬆️ Buy - CHFJPY broke resistance zone - Likely to rise to resistance level…

1 hour ago

The crypto market is stuck in the mud

Market Picture The crypto market has been hovering in a narrow range for the past…

6 hours ago

FTSE 100 Wave Analysis – 17 March 2025

FTSE 100: ⬆️ Buy - FTSE 100 reversed from key support level 8425.00 - Likely…

22 hours ago

Alibaba Wave Analysis – 17 March 2025

Alibaba: ⬆️ Buy - Alibaba broke the key resistance level 145.00 - Likely to rise…

22 hours ago

EURNZD Wave Analysis – 17 March 2025

EURNZD: ⬇️ Sell - EURNZD reversed from long-term resistance level 1.9160 - Likely to fall…

1 day ago

This website uses cookies