Categories: Technical analysis

GBPUSD Wave Analysis 25 October 2023

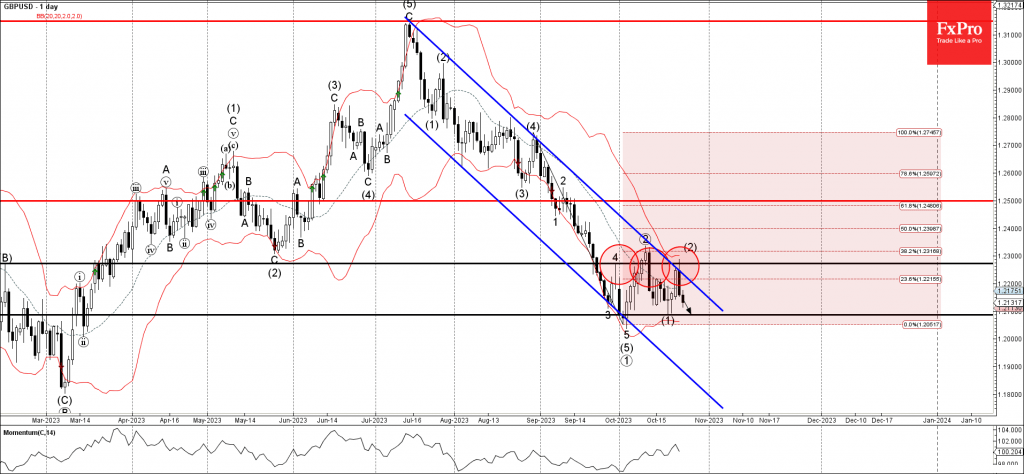
– GBPUSD reversed from resistance level 1.2270

– Likely to fall to support level 1.2085

GBPUSD earlier reversed down with the Piercing Line candlesticks pattern from the key resistance level 1.2270 (which also stopped the previous waves 4 and 2).

The resistance level 1.2270 was strengthened by the upper daily Bollinger Band, 38.2% Fibonacci correction of the previous downward impulse from August and the resistance trendline of the daily down channel from July.

Given the moderate USD bullishness, GBPUSD can be expected to fall further toward the next support level 1.2085 (low of the previous waves (5) and (1)).

The FxPro Tech Analysis Team

The FxPro technical experts prepare a daily analysis of the most active currency pairs (majors, crosses, exotics) and commodities. Selected instruments are reviewed on daily trends (D1, H4), using the active Elliott Wave setups, Japanese candlesticks, indicators, and support/resistance levels.

Share
Published by
The FxPro Tech Analysis Team
Tags: GBPUSD

Recent Posts

Pro News Weekly: Market Shake-Up, Dollar Drops, Gold Surges, Bitcoin Wobbles!

Welcome to Pro News Flash! 💵 The U.S. dollar slips 🏆 Major stock indices struggle…

3 hours ago

Solana Wave Analysis – 5 December 2025

Solana: ⬇️ Sell - Solana reversed from resistance zone - Likely to fall to support…

3 hours ago

EURAUD Wave Analysis – 5 December 2025

EURAUD : ⬇️ Sell - EURAUD broke the support level 1.7600 - Likely to fall…

3 hours ago

Forex has set its priorities

In 2026, experts favour the yen, see modest euro growth, and expect pressure on the…

8 hours ago

Bear market rebound in crypto is likely to continue

Crypto rebounds continue; Bitcoin faces resistance, with a mixed market outlook ahead, as regulatory changes…

9 hours ago

Coca-Cola Wave Analysis – 4 December 2025

Coca-Cola: ⬇️ Sell - Coca-Cola reversed from long-term resistance level 73.25 - Likely to fall to…

22 hours ago

This website uses cookies