Categories: Technical analysis

GBPUSD Wave Analysis 24 September 2024

– GBPUSD broke resistance area

– Likely to rise to resistance level 1.3500

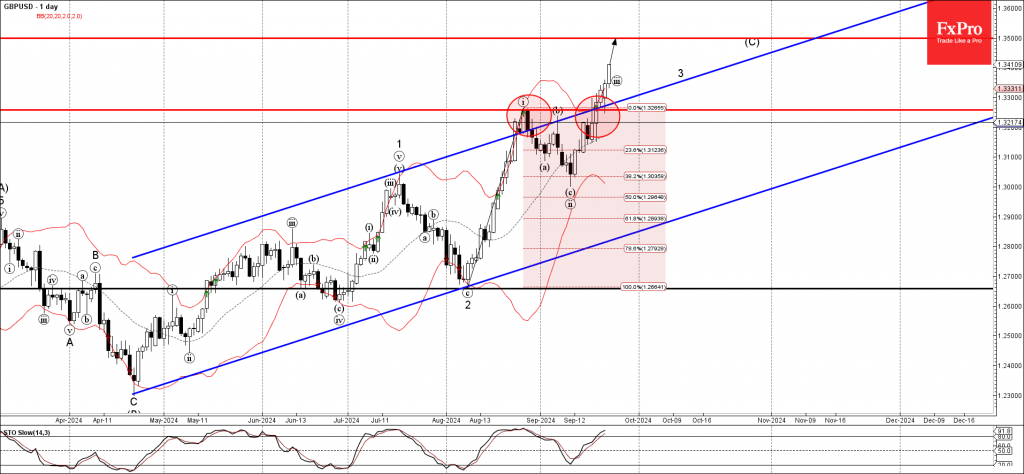
GBPUSD recently broke the resistance area located at the intersection of the key resistance level 1.3255 (former monthly high from August) and the resistance trendline of the daily up channel from April.

The breakout of this resistance area accelerated the active impulse waves iii and 3  – which belong to the multi-month upward impulse sequence (C) from April.

Given the clear daily uptrend and the strongly bearish US dollar sentiment, GBPUSD can be expected to rise further to the next resistance level 1.3500, target for the completion of wave (C).

The FxPro Tech Analysis Team

The FxPro technical experts prepare a daily analysis of the most active currency pairs (majors, crosses, exotics) and commodities. Selected instruments are reviewed on daily trends (D1, H4), using the active Elliott Wave setups, Japanese candlesticks, indicators, and support/resistance levels.

Share
Published by
The FxPro Tech Analysis Team
Tags: GBPUSD

Recent Posts

Platinum Wave Analysis – 8 January 2026

Platinum: ⬇️ Sell - Platinum reversed from pivotal resistance level 150.00 - Likely to fall to…

10 hours ago

Baidu Wave Analysis – 8 January 2026

Baidu: ⬇️ Sell - Baidu reversed from resistance zone - Likely to fall to support level…

10 hours ago

EURUSD Wave Analysis – 8 January 2026

EURUSD: ⬇️ Sell - EURUSD broke daily up channel - Likely to fall to support…

12 hours ago

WTI crude oil Wave Analysis – 8 January 2026

WTI crude oil: ⬆️ Buy - WTI crude oil reversed from support zone - Likely…

12 hours ago

Do not underestimate dollar

Positive macro statistics for the US are helping the greenback. Gold could rise to $4,610…

19 hours ago

Crypto fails to find support for a breakout

Crypto markets fell amid caution; Bitcoin and Ethereum face technical and investor shifts, with privacy…

20 hours ago

This website uses cookies