Categories: Technical analysis

GBPUSD Wave Analysis 23 November, 2020

• GBPUSD broke key resistance level 1.3300

• Likely to rise to 1.3480

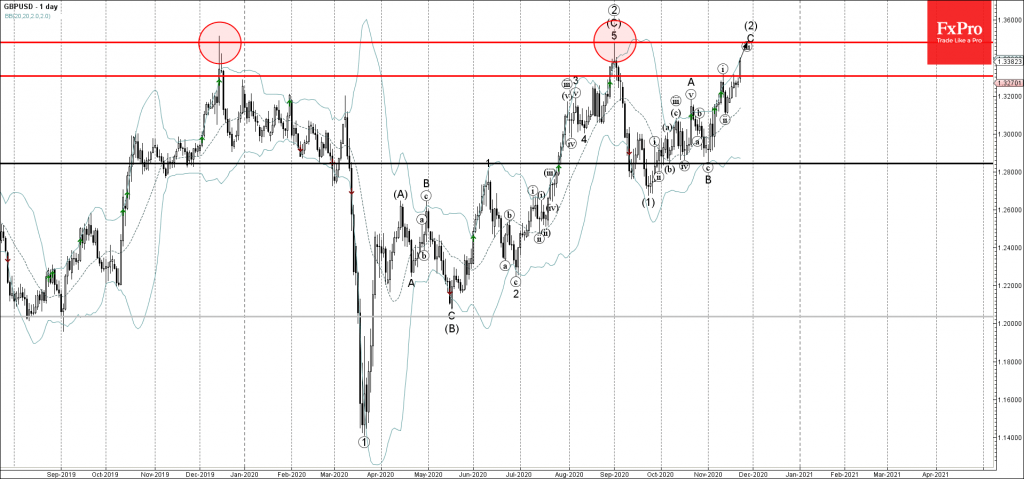
GBPUSD recently broke sharply through the key resistance level 1.3300 (which stopped the previous sharp upward impulse wave (i) at the start of this month).

The breakout of the resistance level 1.3300 accelerated the active minor impulse wave C of the medium-term ABC correction (2) from September.

GBPUSD is likely to rise further toward the next powerful resistance level 1.3480 (multi-month resistance level from the end of 2019 and the target price for the completion of the active corrective wave 2.).

The FxPro Tech Analysis Team

The FxPro technical experts prepare a daily analysis of the most active currency pairs (majors, crosses, exotics) and commodities. Selected instruments are reviewed on daily trends (D1, H4), using the active Elliott Wave setups, Japanese candlesticks, indicators, and support/resistance levels.

Share
Published by
The FxPro Tech Analysis Team
Tags: GBPUSD

Recent Posts

AUDJPY Wave Analysis – 5 December 2025

AUDJPY: ⬆️ Buy - AUDJPY broke long-term resistance level 102.30 - Likely to rise to…

1 day ago

Aptos Wave Analysis – 5 December 2025

Aptos: ⬇️ Sell - Aptos testing major support at 1.688 - Likely to fall to…

1 day ago

Pro News Weekly: Market Shake-Up, Dollar Drops, Gold Surges, Bitcoin Wobbles!

Welcome to Pro News Flash! 💵 The U.S. dollar slips 🏆 Major stock indices struggle…

1 day ago

Solana Wave Analysis – 5 December 2025

Solana: ⬇️ Sell - Solana reversed from resistance zone - Likely to fall to support…

1 day ago

EURAUD Wave Analysis – 5 December 2025

EURAUD : ⬇️ Sell - EURAUD broke the support level 1.7600 - Likely to fall…

1 day ago

Forex has set its priorities

In 2026, experts favour the yen, see modest euro growth, and expect pressure on the…

2 days ago

This website uses cookies