Categories: Technical analysis

GBPUSD Wave Analysis 21 October, 2020

• GBPUSD rising inside impulse wave C

• Likely to reach 1.3270

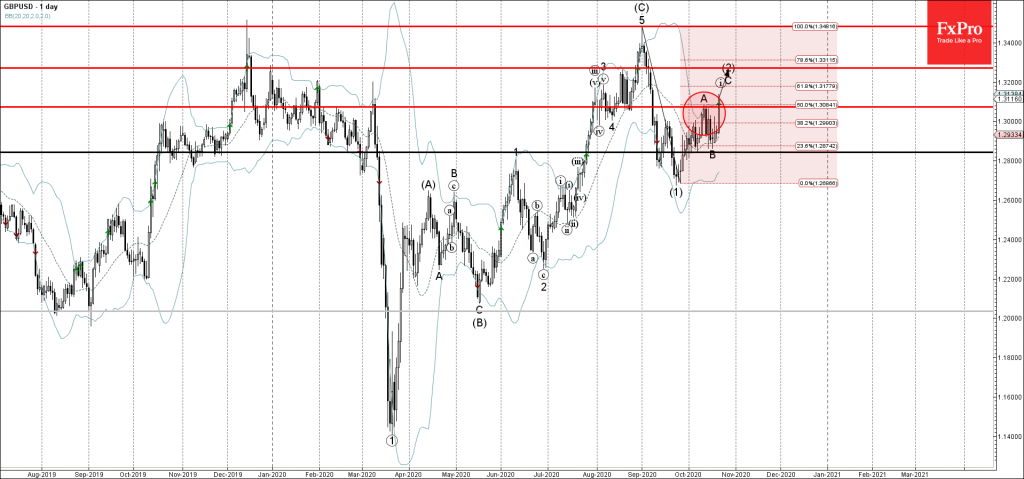
GBPUSD continues to rise inside the short-term impulse wave C, which previously broke the key resistance level 1.3075 (top of the earlier corrective wave A from the start of October).

The breakout of the resistance level 1.3075 coincided with the breakout of the 50% Fibonacci correction of the downward impulse (1) from.                       

GBPUSD is likely to rise further toward the next resistance level 1.3270 (projected price for the completion of the active impulse wave C).

The FxPro Tech Analysis Team

The FxPro technical experts prepare a daily analysis of the most active currency pairs (majors, crosses, exotics) and commodities. Selected instruments are reviewed on daily trends (D1, H4), using the active Elliott Wave setups, Japanese candlesticks, indicators, and support/resistance levels.

Share
Published by
The FxPro Tech Analysis Team
Tags: GBPUSD

Recent Posts

Video: Dollar and Indices are trying to find footing after the fall

The dollar experienced a sell-off but rallied back up by the end of the week.…

2 days ago

What is next: BoJ, Fed, SNB & BoE Rates

The new week will be packed with economic data and decisions from key central banks.…

2 days ago

Dollar attempts to rebound after oversold conditions

Despite economic factors working against the dollar, its oversold condition helped it this week or…

2 days ago

USDCAD Wave Analysis – 14 March 2025

USDCAD: ⬇️ Sell - USDCAD reversed from key resistance level 1.4500 - Likely to fall…

2 days ago

Solana Wave Analysis – 14 March 2025

Solana: ⬆️ Buy - Solana reversed from the long-term support level 113.75 - Likely to…

2 days ago

Adobe Wave Analysis – 13 March 2025

Adobe: ⬇️ Sell - Adobe broke round support level 400.00 - Likely to fall to…

3 days ago

This website uses cookies