Categories: Technical analysis

GBPUSD Wave Analysis 19 July 2024

– GBPUSD reversed from resistance area

– Likely to fall to support level 1.2820

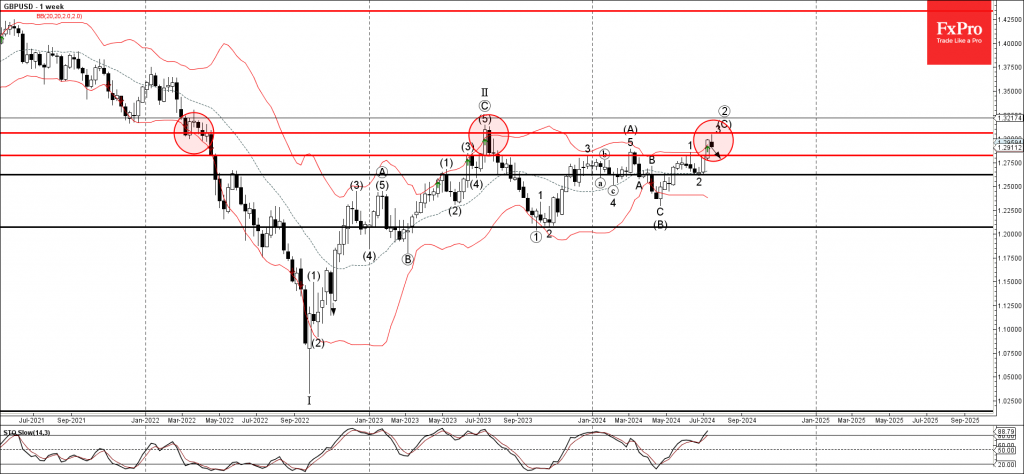
GBPUSD currency pair earlier reversed down from the resistance area located between the key resistance level 1.3060 (which stopped the multi-month uptrend in July) and the upper weekly Bollinger Band.

The downward reversal from this resistance area stopped the previous weekly impulse wave of the longer-term upward impulse wave (C).

Given the overbought daily Stochastic, GBPUSD currency pair can be expected to fall further to the next support level 1.2820.

The FxPro Tech Analysis Team

The FxPro technical experts prepare a daily analysis of the most active currency pairs (majors, crosses, exotics) and commodities. Selected instruments are reviewed on daily trends (D1, H4), using the active Elliott Wave setups, Japanese candlesticks, indicators, and support/resistance levels.

Share
Published by
The FxPro Tech Analysis Team
Tags: GBPUSD

Recent Posts

Weak Chinese data paves the way for lower yuan

Saturday's statistics from China added to fears of a slowdown in the world's second-largest economy,…

5 hours ago

A new local peak in crypto?

Market Picture The crypto market started the weekend on a positive note but has been…

11 hours ago

Fed rate decision: intrigue returns

Influential financial media are promoting the need for a 50-basis point rate cut. The Fed's…

2 days ago

GBPCAD Wave Analysis 13 September 2024

GBPCAD reversed from strong resistance level 1.7850 Likely to fall to support level 1.7700 GBPCAD…

3 days ago

Ebay Wave Analysis 13 September 2024

- Ebay broke resistance level 62.00   - Likely to rise to the resistance level…

3 days ago

Gold broke through the ceiling

After three weeks of consolidation, gold moved decisively upwards, hitting a record above $2572 per…

3 days ago

This website uses cookies