Categories: Technical analysis

GBPUSD Wave Analysis – 17 March, 2020

  • GBPUSD broke pivotal support level 1.2200
  • Further losses likely toward 1.1945

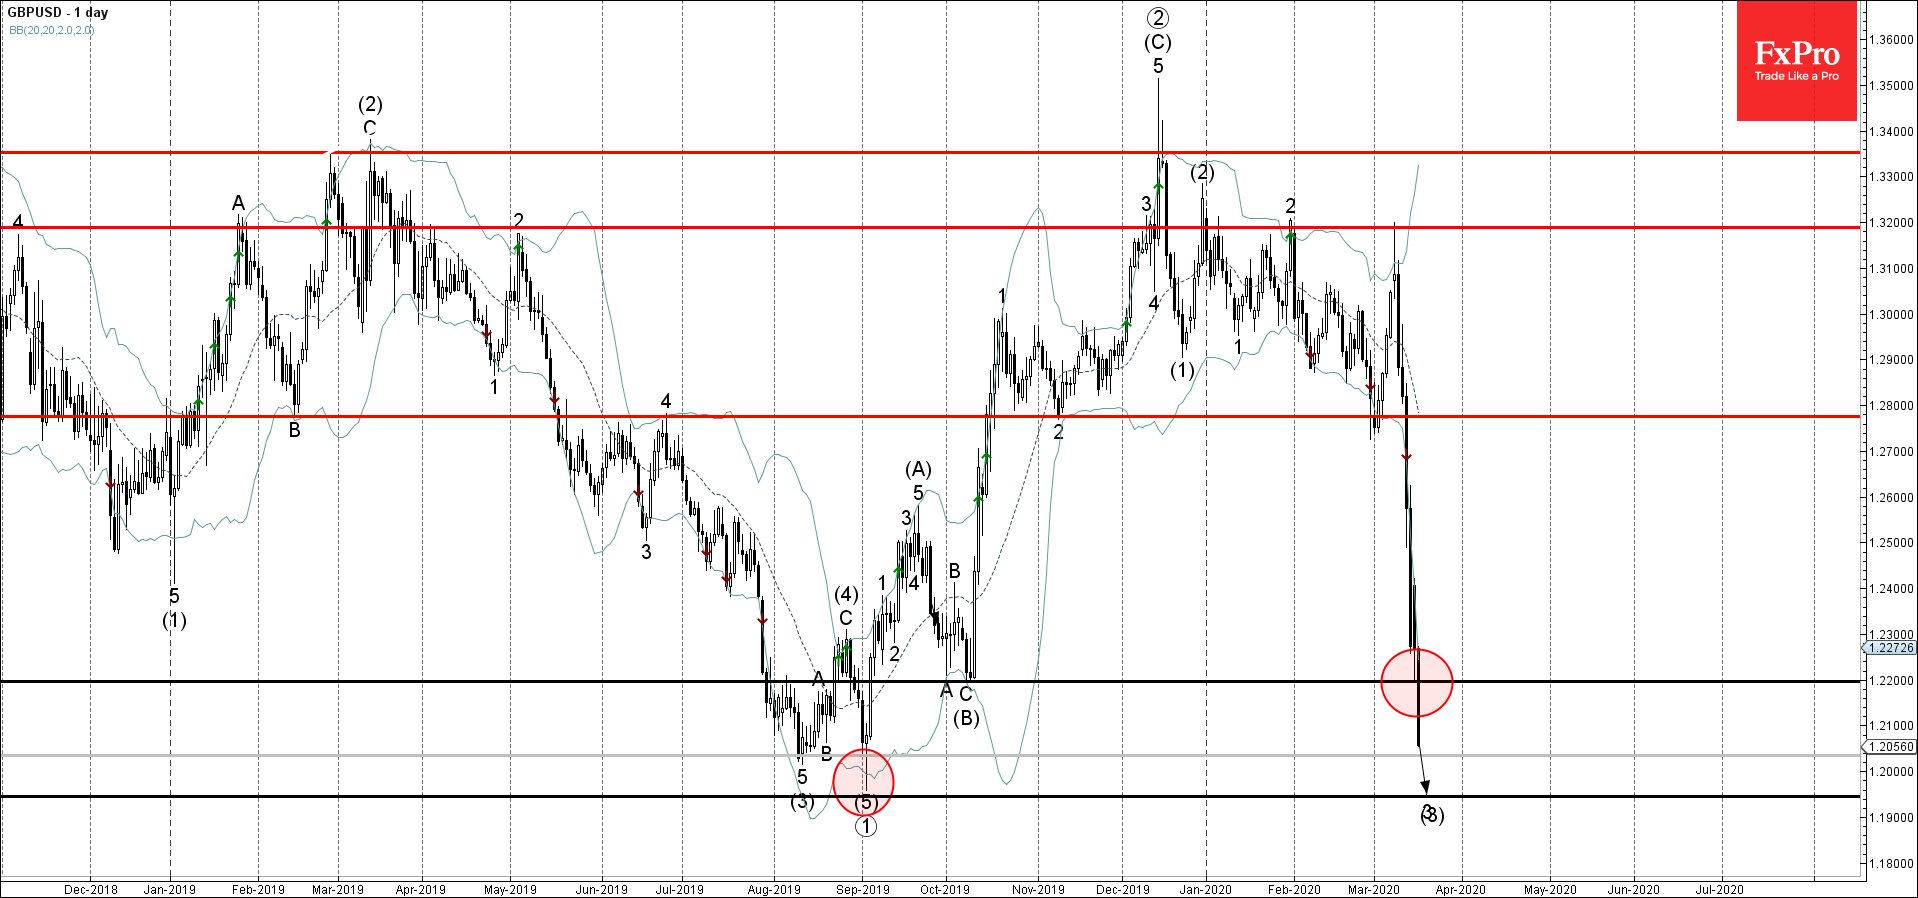
GBPUSD under bearish pressure after the recent breakout of the pivotal support level 1.2200 (low of the previous intermediate ABC correction (B) from October).

The breakout of the support level 1.2200 greatly accelerated the active short-term impulse wave 3 which belongs to the extended downward impulse sequence (3) from December.

GBPUSD is likely to fall further toward the next support level 1.1945 (former powerful support from last September and the likely price for the completion of the active impulse wave (3)).


The FxPro Tech Analysis Team

The FxPro technical experts prepare a daily analysis of the most active currency pairs (majors, crosses, exotics) and commodities. Selected instruments are reviewed on daily trends (D1, H4), using the active Elliott Wave setups, Japanese candlesticks, indicators, and support/resistance levels.

Share
Published by
The FxPro Tech Analysis Team
Tags: GBPUSD

Recent Posts

Markets pick up signals from the White House

Donald Trump has no intention of dismissing Jerome Powell. The White House's decision to postpone…

12 minutes ago

Bitcoin aims to break out of a corrective rebound

Crypto market rebounds, Bitcoin eyes $100K, Dash surges, institutional demand rises, and Ethereum staking hits…

36 minutes ago

Bitcoin Wave Analysis – 14 January 2026

Bitcoin: ⬆️ Buy - Bitcoin broke resistance area - Likely to rise to resistance level…

15 hours ago

NZDJPY Wave Analysis – 14 January 2026

NZDJPY: ⬇️ Sell - NZDJPY reversed down from the resistance area - Likely to fall…

15 hours ago

What is Leverage?

Leverage is a mechanism that lets traders control larger positions using smaller capital. By choosing…

20 hours ago

The dollar does not tolerate dissent

US GDP growth is driven not by the White House, but by AI. The Bank…

1 day ago

This website uses cookies