Categories: Technical analysis

GBPUSD Wave Analysis 16 September 2024

– GBPUSD reversed from support zone

– Likely to rise to the resistance level 1.3255

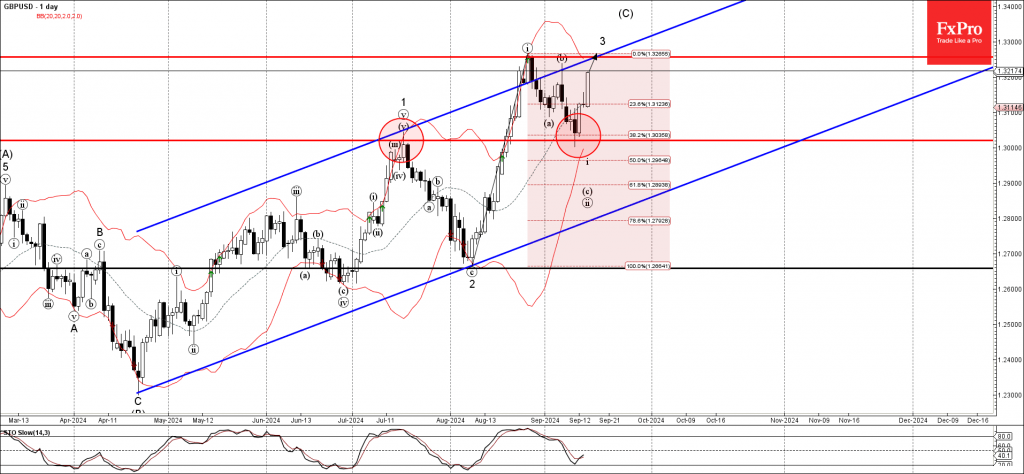
GBPUSD currency pair continues to rise strongly after the earlier upward reversal from the support zone set between the support level 1.3020 (former resistance from July) and the 38.2% Fibonacci correction of the upward impulse from August.

The upward reversal from this support zone created the daily Japanese candlesticks reversal pattern Bullish Engulfing.

Given the strong daily uptrend and the bearish US dollar sentiment, GBPUSD currency pair can be expected to rise further to the next resistance level 1.3255 (former monthly high from August).

The FxPro Tech Analysis Team

The FxPro technical experts prepare a daily analysis of the most active currency pairs (majors, crosses, exotics) and commodities. Selected instruments are reviewed on daily trends (D1, H4), using the active Elliott Wave setups, Japanese candlesticks, indicators, and support/resistance levels.

Share
Published by
The FxPro Tech Analysis Team
Tags: GBPUSD

Recent Posts

AUDCAD Wave Analysis 18 September 2024

- AUDCAD broke pivotal resistance level 0.9170 - Likely to rise to resistance level 0.9260…

9 hours ago

WTI Wave Analysis 18 September 2024

- WTI reversed from round resistance level 70.00 - Likely to fall to support level…

9 hours ago

Strong data didn’t derail markets from expectations of a 50bp Fed cut

US retail sales rose 0.1% m/m in August, better than forecast, but sales growth in…

17 hours ago

The crypto market gets a boost from stocks

Market Picture The crypto market has gained 2.1% in the last 24 hours to reach…

20 hours ago

MasterCard Wave Analysis 17 September 2024

- MasterCard broke round resistance level 500.00 - Likely to rise to the resistance level…

1 day ago

CHFJPY Wave Analysis 17 September 2024

- CHFJPY reversed from support zone - Likely to rise to the resistance level 168.45…

1 day ago

This website uses cookies