Categories: Technical analysis

GBPUSD Wave Analysis 14 November 2024

– GBPUSD reversed from strong support level 1.2665

– Likely to rise to resistance level 1.2840

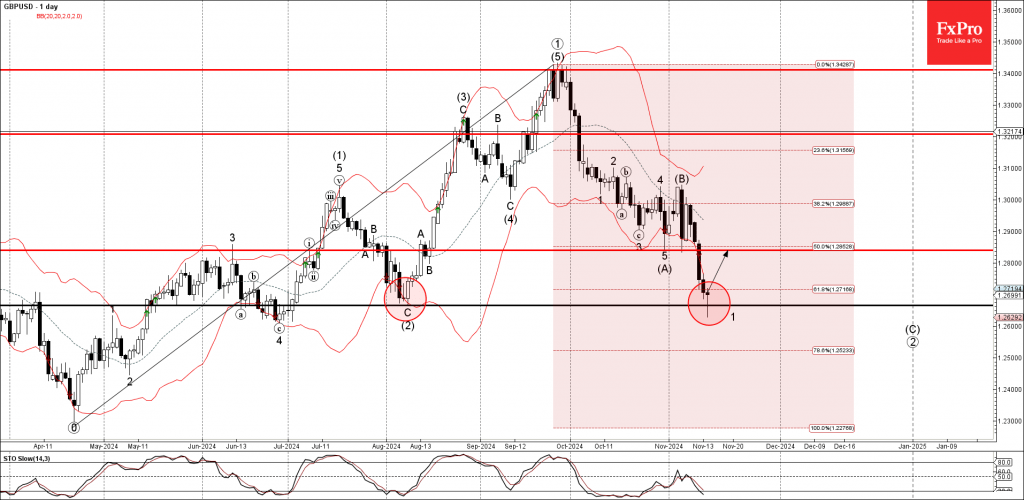
GBPUSD currency pair recently reversed up from the strong support level 1.2665 (former monthly low from August), standing close to the lower daily Bollinger Band and the 61.8% Fibonacci correction of the upward impulse from April.

The upward reversal from the support level 1.2665 created the daily Japanese candlesticks reversal pattern Hammer Doji.

Given the strength of the support level 1.2665 and the oversold daily Stochastic, GBPUSD currency pair can be expected to rise to the next resistance level 1.2840, former support from the end of October.

The FxPro Tech Analysis Team

The FxPro technical experts prepare a daily analysis of the most active currency pairs (majors, crosses, exotics) and commodities. Selected instruments are reviewed on daily trends (D1, H4), using the active Elliott Wave setups, Japanese candlesticks, indicators, and support/resistance levels.

Share
Published by
The FxPro Tech Analysis Team
Tags: GBPUSD

Recent Posts

Video: Dollar and Indices are trying to find footing after the fall

The dollar experienced a sell-off but rallied back up by the end of the week.…

2 days ago

What is next: BoJ, Fed, SNB & BoE Rates

The new week will be packed with economic data and decisions from key central banks.…

2 days ago

Dollar attempts to rebound after oversold conditions

Despite economic factors working against the dollar, its oversold condition helped it this week or…

2 days ago

USDCAD Wave Analysis – 14 March 2025

USDCAD: ⬇️ Sell - USDCAD reversed from key resistance level 1.4500 - Likely to fall…

2 days ago

Solana Wave Analysis – 14 March 2025

Solana: ⬆️ Buy - Solana reversed from the long-term support level 113.75 - Likely to…

2 days ago

Adobe Wave Analysis – 13 March 2025

Adobe: ⬇️ Sell - Adobe broke round support level 400.00 - Likely to fall to…

3 days ago

This website uses cookies