Categories: Technical analysis

GBPUSD Wave Analysis 13 October, 2020

• GBPUSD reversed from resistance area

• Likely to fall 1.2845

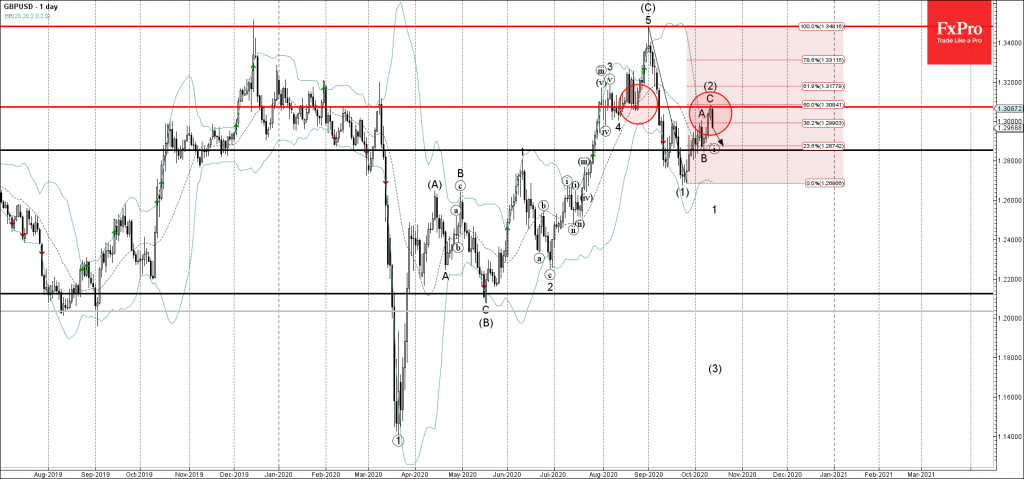
GBPUSD recently reversed down from the resistance area lying between the resistance level 1.3075, upper daily Bollinger band and the 50% Fibonacci correction of the downward impulse (1) from August.

The downward reversal from this resistance area stopped the previous medium-term ABC correction (2).

GBPUSD is likely to fall further toward the next support level 1.2845 (low of the previous minor corrective wave B from the start of October).

The FxPro Tech Analysis Team

The FxPro technical experts prepare a daily analysis of the most active currency pairs (majors, crosses, exotics) and commodities. Selected instruments are reviewed on daily trends (D1, H4), using the active Elliott Wave setups, Japanese candlesticks, indicators, and support/resistance levels.

Share
Published by
The FxPro Tech Analysis Team
Tags: GBPUSD

Recent Posts

Strong macro data and rate spreads are the USD’s main weapon

Strong US macro data and wide rate spreads boost the dollar, pressuring EURUSD and gold;…

2 hours ago

Top 10 Forex Trading Strategies

We have outlined the 10 best forex trading strategies with clear logic, real-world context, and…

3 hours ago

Bitcoin has not crossed the correction line

Bitcoin holds near $95.5K as the market steadies but hasn't confirmed a exit from correction…

3 hours ago

CHFJPY Wave Analysis – 15 January 2026

CHFJPY: ⬇️ Sell - CHFJPY reversed from resistance zone - Likely to fall to support level…

15 hours ago

WTI Crude Oil Wave Analysis – 15 January 2026

WTI Crude Oil: ⬇️ Sell - WTI Crude Oil rising inside minor impulse wave (1) -…

15 hours ago

Costco Wave Analysis – 15 January 2026

Costco: ⬆️ Buy - Costco rising inside minor impulse wave (1) - Likely to reach resistance…

15 hours ago

This website uses cookies