Categories: Technical analysis

GBPUSD Wave Analysis 11 October 2024

– GBPUSD reversed from support zone

– Likely to rise to resistance level 1.3200

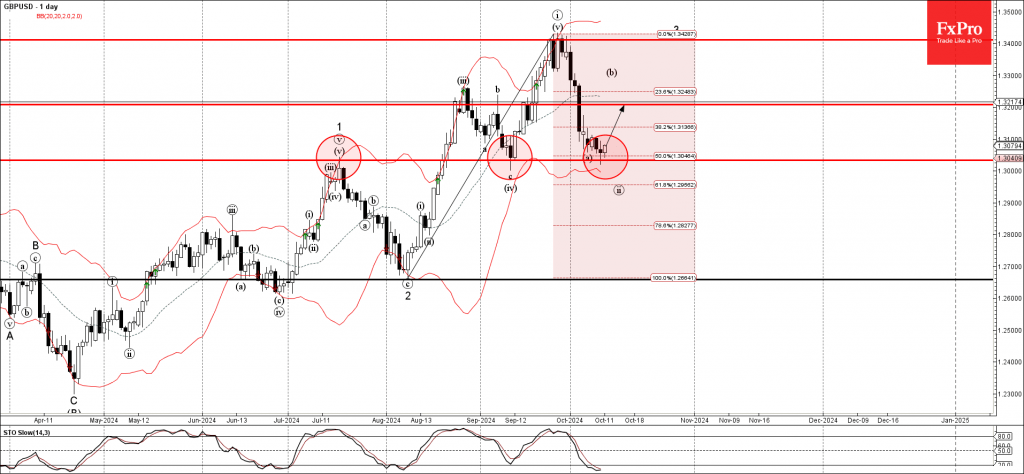
GBPUSD currency pair recently reversed up from the support zone located between the pivotal support level 1.3030 (former monthly high from July), lower daily Bollinger Band and the 50% Fibonacci correction of the upward impulse from August.

The upward reversal from this support zone stopped the previous minor correction ii from the end of September.

Given the clear daily uptrend and the oversold daily Stochastic, GBPUSD currency pair be expected to rise further to the next resistance level 1.3200.

The FxPro Tech Analysis Team

The FxPro technical experts prepare a daily analysis of the most active currency pairs (majors, crosses, exotics) and commodities. Selected instruments are reviewed on daily trends (D1, H4), using the active Elliott Wave setups, Japanese candlesticks, indicators, and support/resistance levels.

Share
Published by
The FxPro Tech Analysis Team
Tags: GBPUSD

Recent Posts

NZDCAD Wave Analysis – 7 January 2026

NZDCAD: ⬆️ Buy - NZDCAD reversed from support zone - Likely to rise to resistance…

4 hours ago

Bitcoin Wave Analysis – 7 January 2026

Bitcoin: ⬇️ Sell - Bitcoin reversed from resistance zone - Likely to fall to support…

4 hours ago

EURGBP Wave Analysis – 7 January 2026

EURGBP: ⬆️ Buy - EURGBP reversed from support zone - Likely to rise to resistance…

4 hours ago

Brent Crude Oil Wave Analysis – 7 January 2026

Brent Crude Oil: ⬇️ Sell - Brent Crude Oil reversed from resistance zone - Likely…

4 hours ago

Old fears about the euro have returned

The resurgence of the political crisis in France is weighing on EURUSD The US dollar…

13 hours ago

The crypto market has hit the upper limit of its rebound

The crypto market faces resistance at $3.2T; sentiment rises, but selling pressure persists. Bitcoin and…

15 hours ago

This website uses cookies