Categories: Technical analysis

GBPUSD Wave Analysis 10 January 2025

– GBPUSD broke key support level 1.2300

– Likely to fall to support level 1.2100

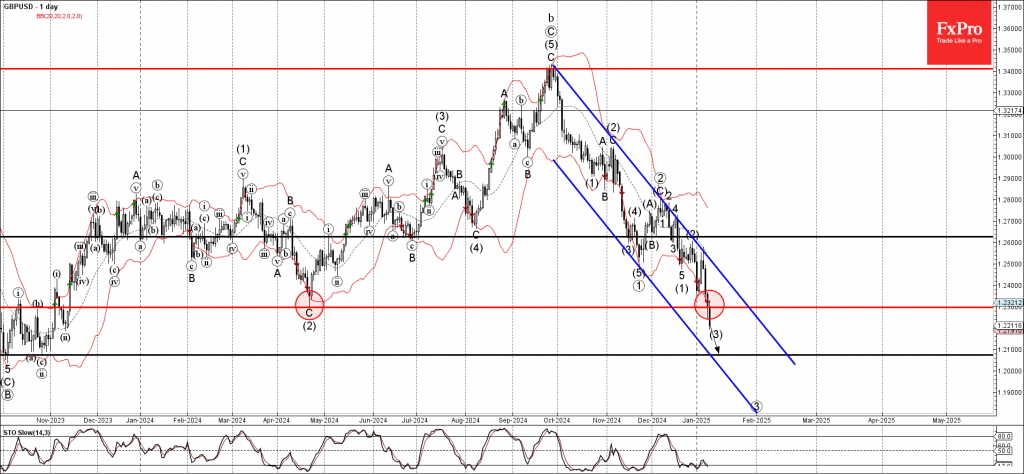
GBPUSD currency pair recently broke the key support level 1.2300 (former multi-month low from April of 2024, as can be seen below from the daily GBPUSD chart below).

The breakout of the support level 1.2300 accelerated the active medium-term impulse wave (3).

Given the medium-term downtrend on the daily charts, GBPUSD currency pair can be expected to fall toward the next support level 1.2100 (former major support from the end of 2023).

The FxPro Tech Analysis Team

The FxPro technical experts prepare a daily analysis of the most active currency pairs (majors, crosses, exotics) and commodities. Selected instruments are reviewed on daily trends (D1, H4), using the active Elliott Wave setups, Japanese candlesticks, indicators, and support/resistance levels.

Share
Published by
The FxPro Tech Analysis Team
Tags: GBPUSD

Recent Posts

JPMorgan Chase Wave Analysis – 18 December 2025

JPMorgan Chase: ⬇️ Sell - JPMorgan Chase reversed from resistance area - Likely to fall…

9 hours ago

EURUSD Wave Analysis – 18 December 2025

EURUSD: ⬇️ Sell - EURUSD reversed from resistance area - Likely to fall to support level…

9 hours ago

AUDJPY Wave Analysis – 18 December 2025

AUDJPY: ⬆️ Buy - AUDJPY reversed from support area - Likely to rise to resistance…

10 hours ago

Palladium Wave Analysis – 18 December 2025

Palladium: ⬆️ Buy - Palladium broke multi-month resistance level 1600.00 - Likely to rise to resistance…

10 hours ago

GBPUSD. Current situation #tradelikeapro #trading #tradingstrategy #tradingshorts #gbpusd #gbp

Today is Thursday, the 18th of December, and we'll be talking about the British pound…

15 hours ago

Bitcoin is holding, while Solana is on the edge

Bitcoin remains stable near $87K, outperforming altcoins, while Solana faces key support at $120. Institutional…

16 hours ago

This website uses cookies