Categories: Technical analysis

GBPUSD Wave Analysis – 10 December , 2018

  • GBPUSD broke multi-month support level 1.2700
  • Further losses are likely

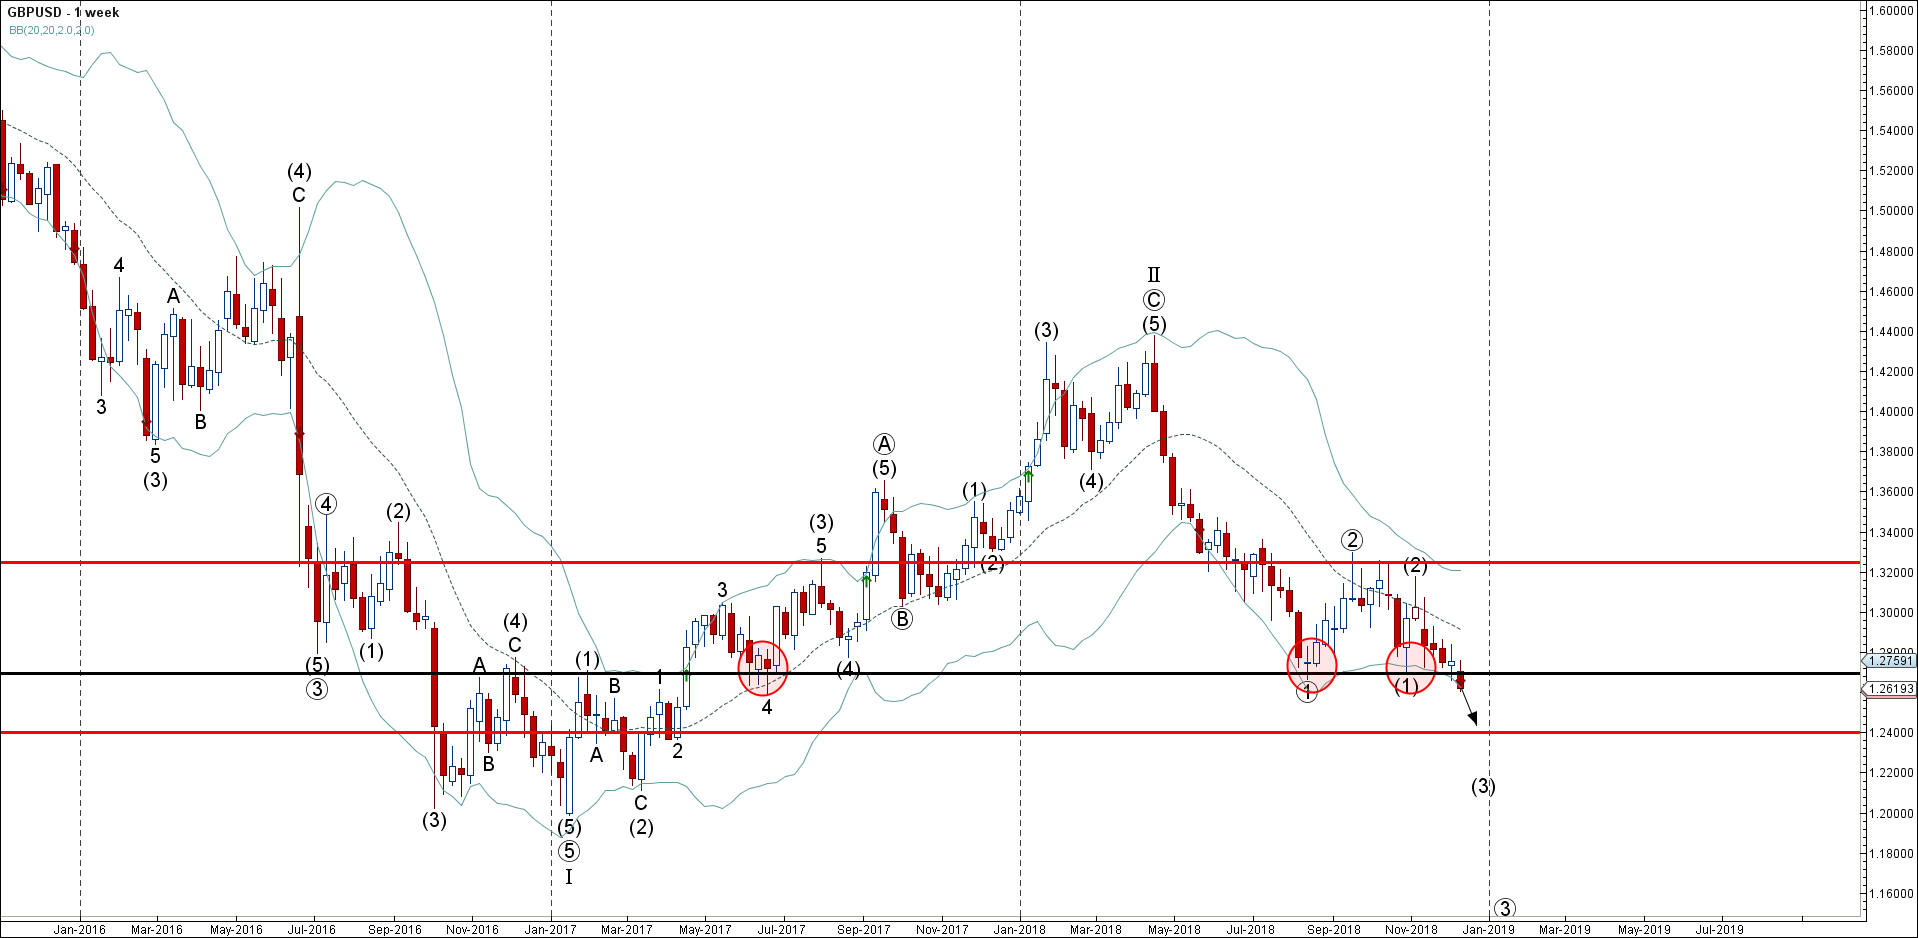
GBPUSD today broke through the strong, multi-month support level 1.2700 (which has been steadily reversing the price from the middle of 2017 – as can be seen from the weekly GBPUSD chart below).

The breakout of the support level 1.2690 continues the active medium-term impulse wave (3) of the long-term downer impulse sequence from September.

GBPUSD is expected to fall further and re-test the next resistance level 1.2400 (former support from April of 2017). Strong resistance now stands at 1.2700.

The FxPro Tech Analysis Team

The FxPro technical experts prepare a daily analysis of the most active currency pairs (majors, crosses, exotics) and commodities. Selected instruments are reviewed on daily trends (D1, H4), using the active Elliott Wave setups, Japanese candlesticks, indicators, and support/resistance levels.

Share
Published by
The FxPro Tech Analysis Team
Tags: GBPUSD

Recent Posts

Forex has set its priorities

In 2026, experts favour the yen, see modest euro growth, and expect pressure on the…

41 minutes ago

Bear market rebound in crypto is likely to continue

Crypto rebounds continue; Bitcoin faces resistance, with a mixed market outlook ahead, as regulatory changes…

2 hours ago

Coca-Cola Wave Analysis – 4 December 2025

Coca-Cola: ⬇️ Sell - Coca-Cola reversed from long-term resistance level 73.25 - Likely to fall to…

15 hours ago

DraftKings Wave Analysis – 4 December 2025

DraftKings: ⬆️ Buy - DraftKings reversed from support zone - Likely to rise to resistance level…

15 hours ago

NVDA Wave Analysis – 4 December 2025

NVDA: ⬆️ Buy - NVDA reversed from support zone - Likely to rise to resistance level…

16 hours ago

Basic Attention Token Wave Analysis – 4 December 2025

Basic Attention Token: ⬇️ Sell - Basic Attention Token reversed from resistance level 0.2800 - Likely…

16 hours ago

This website uses cookies