Categories: Technical analysis

GBPUSD Wave Analysis – 05 March, 2019

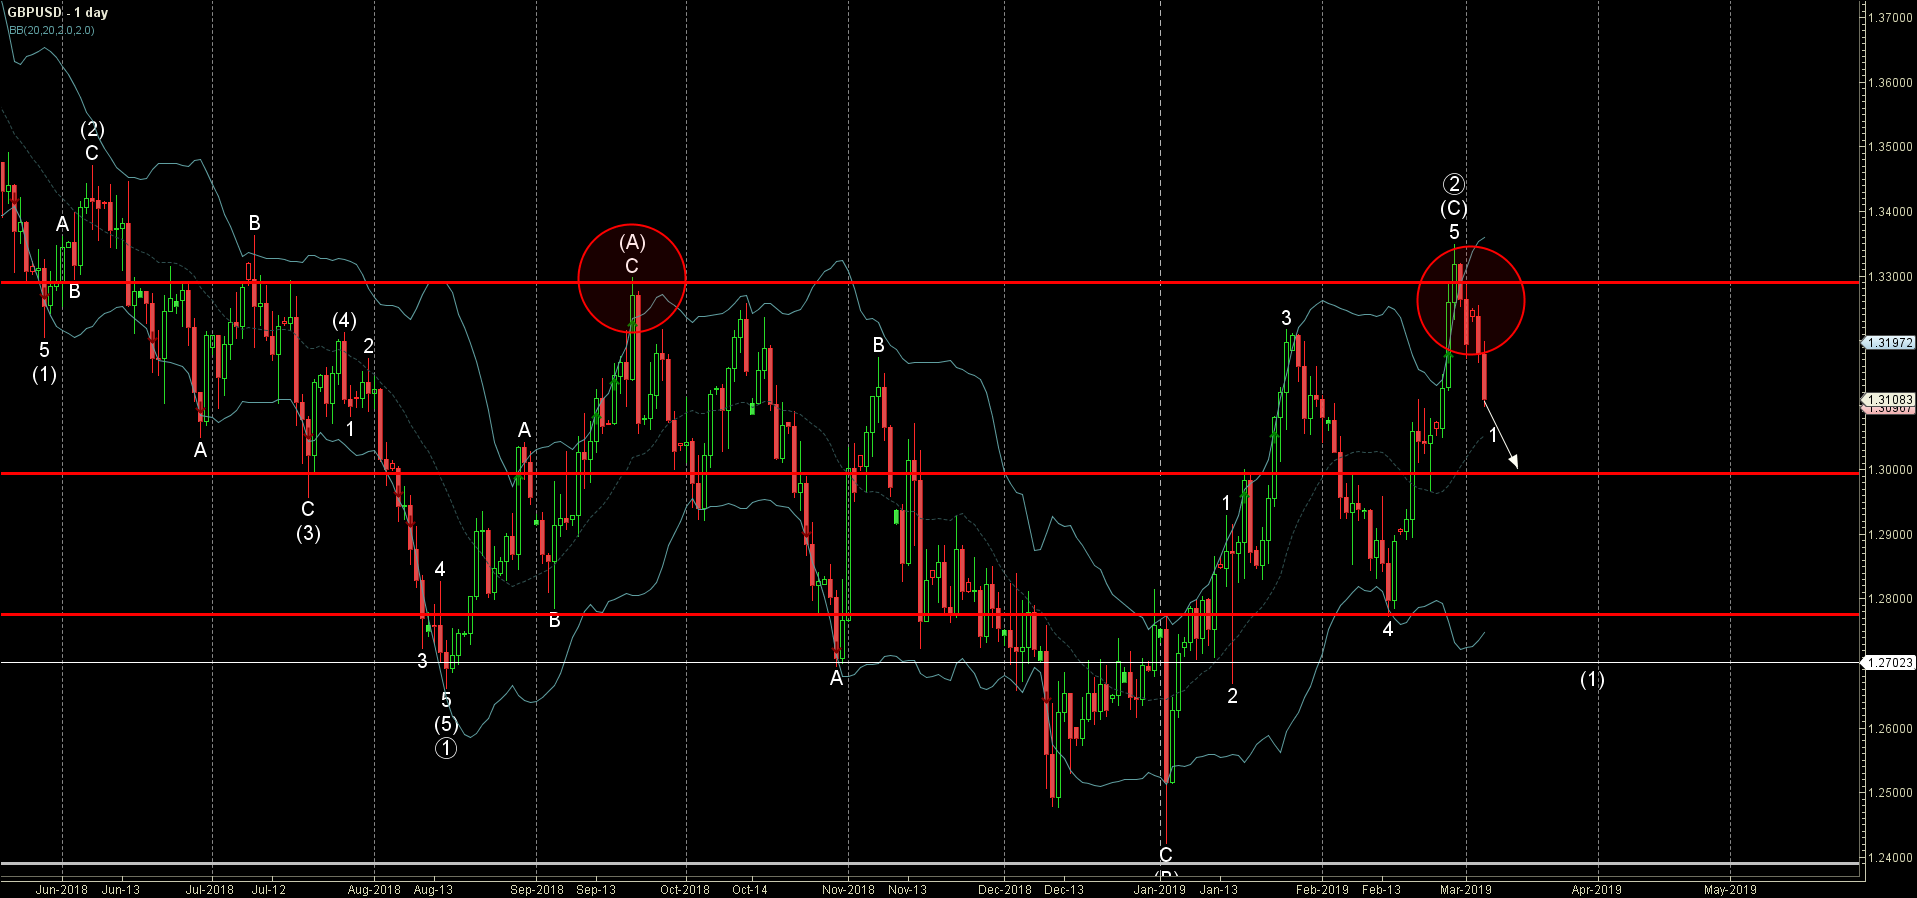
  • GBPUSD reversed from resistance area
  • Further losses are likely


GBPUSD recently reversed down from the resistance area lying between the multi-month resistance level 1.3300 (former monthly high from last September) and the upper daily Bollinger Band.


The downward reversal from this resistance area started the active short-term impulse wave 1 of the medium-term impulse wave (1).


GBPUSD is expected to fall further and re-test the next round support level 1.3000 (low of the daily Hammer from February).

GBPUSD

The FxPro Tech Analysis Team

The FxPro technical experts prepare a daily analysis of the most active currency pairs (majors, crosses, exotics) and commodities. Selected instruments are reviewed on daily trends (D1, H4), using the active Elliott Wave setups, Japanese candlesticks, indicators, and support/resistance levels.

Share
Published by
The FxPro Tech Analysis Team

Recent Posts

Gold Wave Analysis 19 September 2024

- Gold reversed from support level 2550.00 - Likely to rise to resistance level 2600.00…

38 mins ago

S&P 500 Wave Analysis 19 September 2024

- S&P 500 broke key resistance level 5670.00 - Likely to rise to resistance level…

39 mins ago

The Fed’s big rate and projections cut

The Fed cut the rate by 50 bps, This change was not fully factored into…

7 hours ago

Crypto market climbs out of the pit

The crypto market as a whole and Bitcoin hit three-week highs, but are still in…

13 hours ago

AUDCAD Wave Analysis 18 September 2024

- AUDCAD broke pivotal resistance level 0.9170 - Likely to rise to resistance level 0.9260…

1 day ago

WTI Wave Analysis 18 September 2024

- WTI reversed from round resistance level 70.00 - Likely to fall to support level…

1 day ago

This website uses cookies