Categories: Technical analysis

GBPUSD Wave Analysis – 02 November , 2018

  • GBPUSD rising inside corrective wave 2
  • Further gains are likely

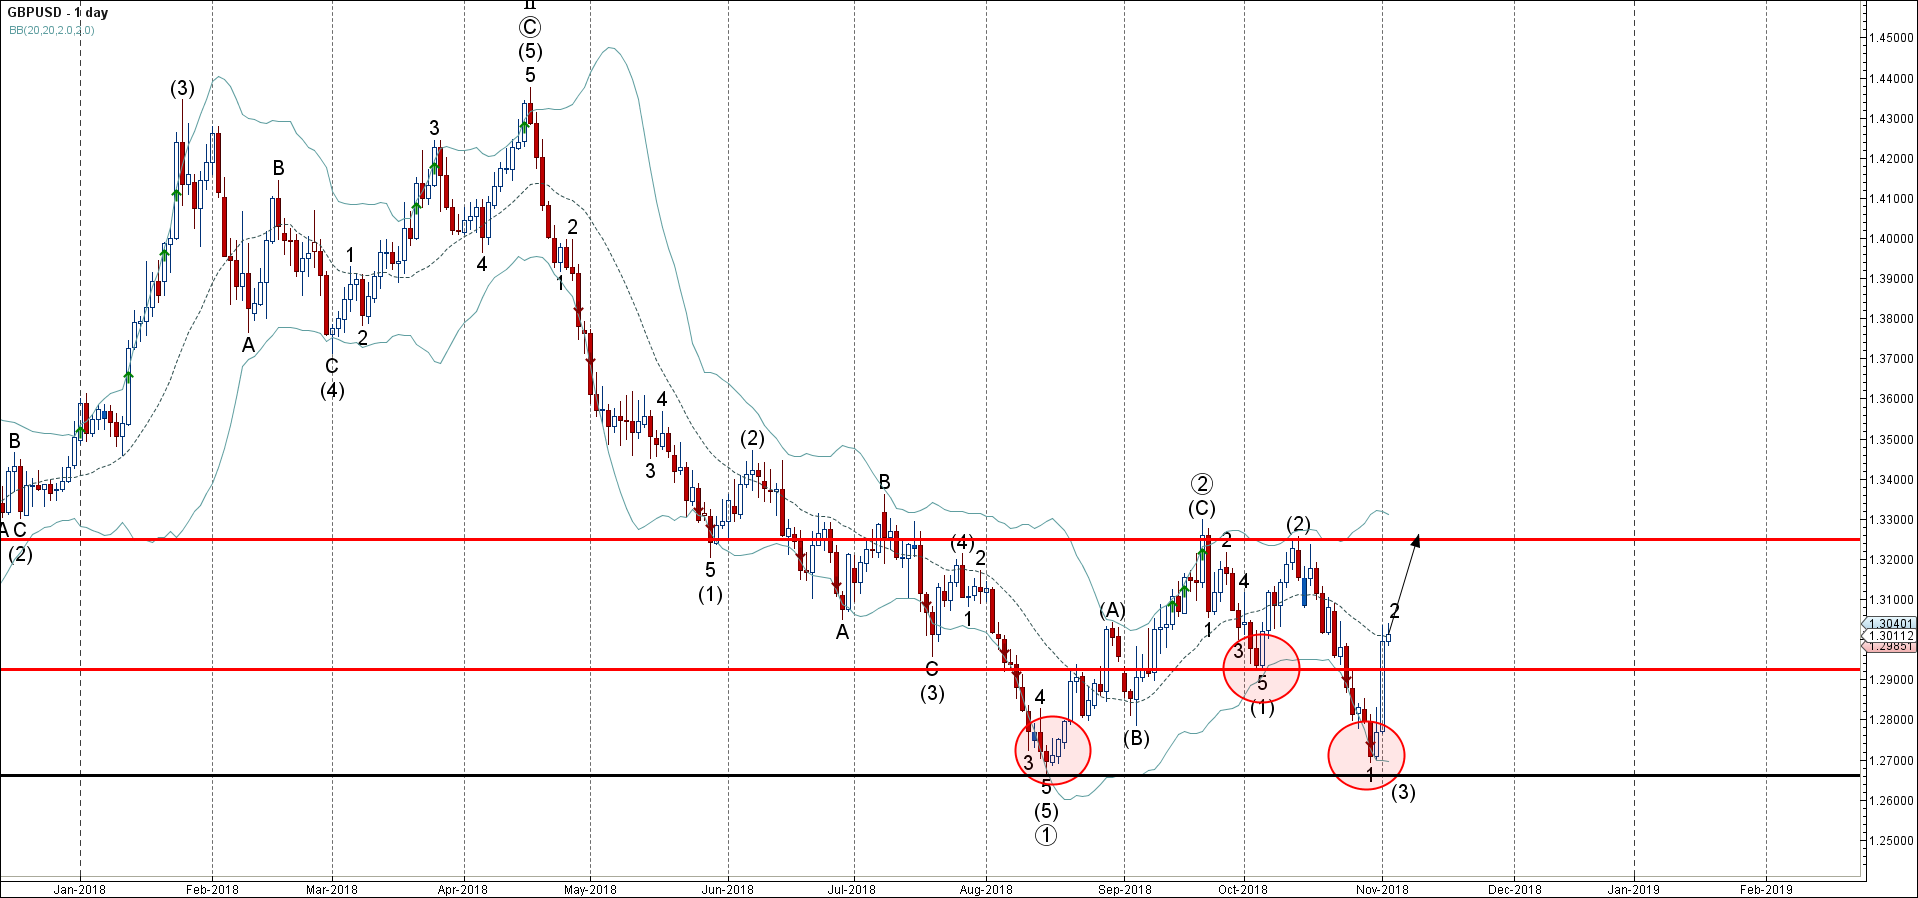
GBPUSD continues to rise inside the sharp short-term corrective wave 2, which started earlier from the support area lying between the strong support level 1.2700 (which stopped the sharp downtrend in the middle of August) and the lower daily Bollinger Band.

The price earlier broke the resistance level 1.2920 (former support from October) – which strengthened the bullish pressure on this currency pair.

GBPUSD is expected to rise further and re-test the next resistance level 1.3250 (top of the previous corrective wave (2) from October).

The FxPro Tech Analysis Team

The FxPro technical experts prepare a daily analysis of the most active currency pairs (majors, crosses, exotics) and commodities. Selected instruments are reviewed on daily trends (D1, H4), using the active Elliott Wave setups, Japanese candlesticks, indicators, and support/resistance levels.

Share
Published by
The FxPro Tech Analysis Team
Tags: GBPUSD

Recent Posts

CHFJPY Wave Analysis – 9 January 2026

CHFJPY: ⬆️ Buy - CHFJPY reversed from support area - Likely to rise to resistance…

13 hours ago

Exxon Mobil Wave Analysis – 9 January 2026

Exxon Mobil: ⬆️ Buy - Exxon Mobil reversed from support area - Likely to rise…

13 hours ago

Pro News Weekly: Dollar Rebounds as Markets Test New Limits

Welcome to Pro News Weekly! Here’s what is shaping the markets: 💵 The U.S. dollar…

17 hours ago

Geopolitics will destroy the euro

•    EURUSD falls due to geopolitics and expectations of tariff removal •    Gold returns to…

1 day ago

Platinum Wave Analysis – 8 January 2026

Platinum: ⬇️ Sell - Platinum reversed from pivotal resistance level 150.00 - Likely to fall to…

2 days ago

Baidu Wave Analysis – 8 January 2026

Baidu: ⬇️ Sell - Baidu reversed from resistance zone - Likely to fall to support level…

2 days ago

This website uses cookies