Categories: Technical analysis

GBPNZD Wave Analysis 9 December 2024

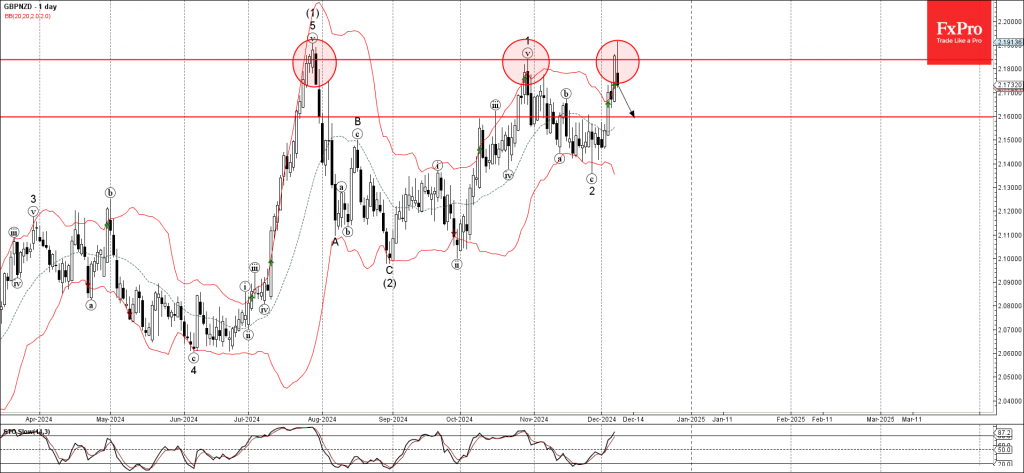
– GBPNZD reversed from key resistance level 2.1840

– Likely to fall to support level 2.1600

GBPNZD currency pair recently reversed down from the resistance zone between the key resistance level 2.1840 (which has been reversing the pair from July) and the upper daily Bollinger Band.

The downward reversal from this resistance zone will likely form the daily Japanese candlesticks reversal pattern Shooting Star.

Given the strength of the resistance level 2.1840 and the overbought daily Stochastic, GBPNZD currency pair can be expected to fall toward the next support level 2.1600.

The FxPro Tech Analysis Team

The FxPro technical experts prepare a daily analysis of the most active currency pairs (majors, crosses, exotics) and commodities. Selected instruments are reviewed on daily trends (D1, H4), using the active Elliott Wave setups, Japanese candlesticks, indicators, and support/resistance levels.

Share
Published by
The FxPro Tech Analysis Team
Tags: GBPNZD

Recent Posts

FTSE 100 Wave Analysis – 17 March 2025

FTSE 100: ⬆️ Buy - FTSE 100 reversed from key support level 8425.00 - Likely…

1 hour ago

Alibaba Wave Analysis – 17 March 2025

Alibaba: ⬆️ Buy - Alibaba broke the key resistance level 145.00 - Likely to rise…

1 hour ago

EURNZD Wave Analysis – 17 March 2025

EURNZD: ⬇️ Sell - EURNZD reversed from long-term resistance level 1.9160 - Likely to fall…

5 hours ago

AUDUSD Wave Analysis – 17 March 2025

AUDUSD: ⬆️ Buy - AUDUSD broke resistance level 0.6350 - Likely to rise to resistance…

5 hours ago

Weak US retail sales might boost stocks

Weak US retail sales are adding to concerns of a potential recession, putting pressure on…

7 hours ago

Dow Jones: Rebound or Rally? The Fed Holds the Key

The Dow Jones rebound depends on the Federal Reserve's monetary policy and incoming data. It…

8 hours ago

This website uses cookies