Categories: Technical analysis

GBPNZD Wave Analysis – 31 July, 2020

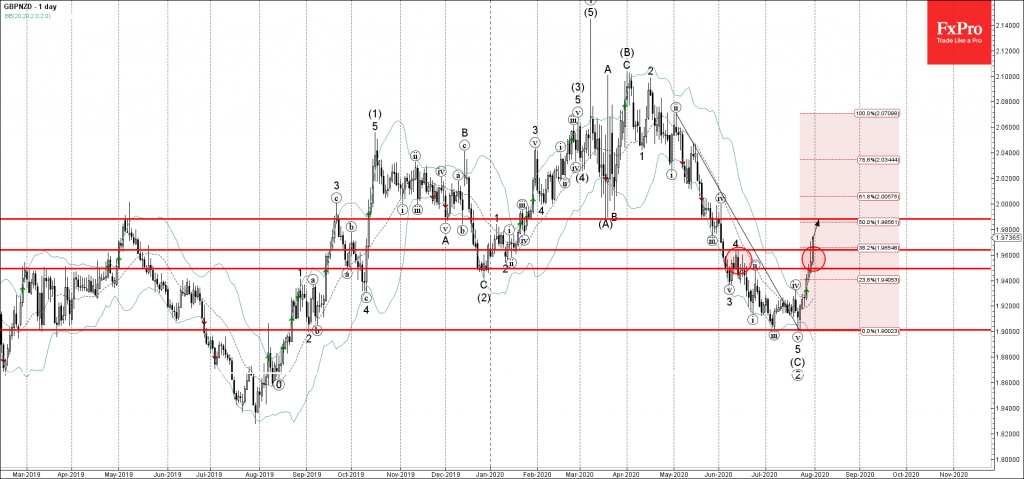
• GBPNZD broke resistance zone

• Likely to rise to 1.9880

GBPNZD recently broke the resistance zone lying between the resistance levels 1.9490 (top of the previous wave (iv)) and 1.9640 (top of wave 4).

The breakout of this resistance zone coincided with the breakout of the 38.2% Fibonacci correction level of the previous sharp downward impulse from May.

GBPNZD is expected to rise further toward the next resistance level 1.9880 (former multi-month support from March).

The FxPro Tech Analysis Team

The FxPro technical experts prepare a daily analysis of the most active currency pairs (majors, crosses, exotics) and commodities. Selected instruments are reviewed on daily trends (D1, H4), using the active Elliott Wave setups, Japanese candlesticks, indicators, and support/resistance levels.

Share
Published by
The FxPro Tech Analysis Team
Tags: GBPNZD

Recent Posts

Amazon Wave Analysis 16 May 2024

- Amazon reversed from resistance level 190.00 - Likely to fall to support level 180.00…

9 hours ago

USDCHF Wave Analysis 16 May 2024

- USDCHF reversed from round support level 0.9000 - Likely to rise to resistance level…

9 hours ago

Crypto market shakes off consolidation

Market picture The release of US inflation data sparked a surge in risk asset purchases,…

20 hours ago

Gold Wave Analysis – 15 May, 2024

• Gold broke daily down channel • Likely to reach resistance level 2415.00 Gold recently…

2 days ago

AUDUSD Wave Analysis – 15 May, 2024

• AUDUSD broke key resistance level 0.6650 • Likely to reach resistance level 0.6760 AUDUSD…

2 days ago

EURUSD is trying to break the 5-month downtrend

The US dollar has been under relentless pressure since last Thursday, approaching more than one-month…

2 days ago

This website uses cookies