Categories: Technical analysis

GBPNZD Wave Analysis – 21 March 2023

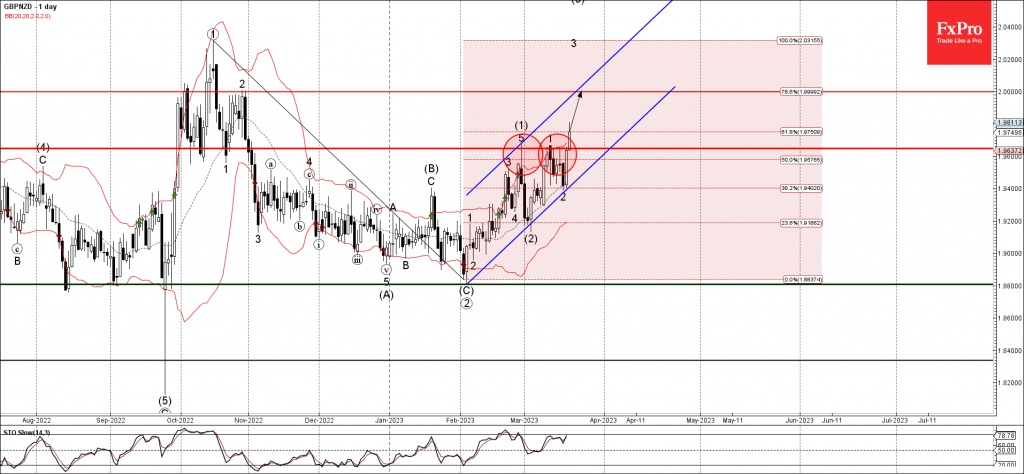
• GBPNZD broke resistance level 1.9650

• Likely to rise to resistance level 2.0000

GBPNZD recently broke the resistance level 1.9650 (earlier strong resistance from February) standing close to the 50% Fibonacci correction of the downward ABC correction from the start of October.

The breakout of the resistance level 1.9650 accelerated the active short-term impulse wave 3, which belongs to the intermediate impulse wave (3) from the start of this month. GBPNZD currency pair can then be expected to rise further toward the next round resistance level 2.0000

The FxPro Tech Analysis Team

The FxPro technical experts prepare a daily analysis of the most active currency pairs (majors, crosses, exotics) and commodities. Selected instruments are reviewed on daily trends (D1, H4), using the active Elliott Wave setups, Japanese candlesticks, indicators, and support/resistance levels.

Share
Published by
The FxPro Tech Analysis Team
Tags: GBPNZD

Recent Posts

FTSE 100 Wave Analysis – 17 March 2025

FTSE 100: ⬆️ Buy - FTSE 100 reversed from key support level 8425.00 - Likely…

60 minutes ago

Alibaba Wave Analysis – 17 March 2025

Alibaba: ⬆️ Buy - Alibaba broke the key resistance level 145.00 - Likely to rise…

1 hour ago

EURNZD Wave Analysis – 17 March 2025

EURNZD: ⬇️ Sell - EURNZD reversed from long-term resistance level 1.9160 - Likely to fall…

5 hours ago

AUDUSD Wave Analysis – 17 March 2025

AUDUSD: ⬆️ Buy - AUDUSD broke resistance level 0.6350 - Likely to rise to resistance…

5 hours ago

Weak US retail sales might boost stocks

Weak US retail sales are adding to concerns of a potential recession, putting pressure on…

7 hours ago

Dow Jones: Rebound or Rally? The Fed Holds the Key

The Dow Jones rebound depends on the Federal Reserve's monetary policy and incoming data. It…

8 hours ago

This website uses cookies