Categories: Technical analysis

GBPNZD Wave Analysis 17 February, 2021

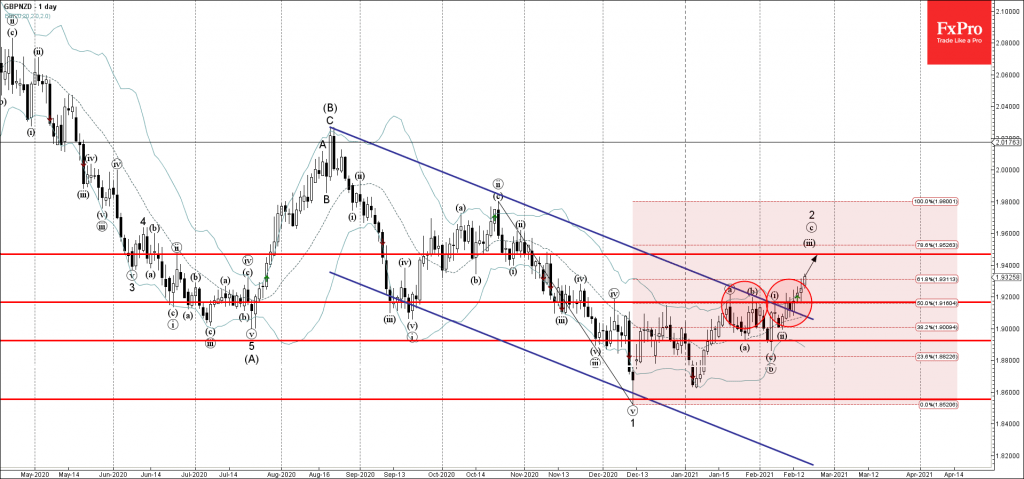
• GBPNZD broke resistance zone

• Likely to rise to resistance level 1.9465

GBPNZD currency pair continues to rise after the price broke the resistance zone lying between the resistance level 1.9165 (which has been reversing the price from December) and the resistance trendline of the daily down channel from August.

The breakout of this resistance zone continues the active minor impulse wave c – which belongs to the ABC correction 2 from the end of 2020.

GBPNZD is likely to rise further toward the next resistance level 1.9465 (likely price for the completion of the active minor impulse wave c).

The FxPro Tech Analysis Team

The FxPro technical experts prepare a daily analysis of the most active currency pairs (majors, crosses, exotics) and commodities. Selected instruments are reviewed on daily trends (D1, H4), using the active Elliott Wave setups, Japanese candlesticks, indicators, and support/resistance levels.

Share
Published by
The FxPro Tech Analysis Team
Tags: GBPNZD

Recent Posts

Bitcoin Wave Analysis – 14 January 2026

Bitcoin: ⬆️ Buy - Bitcoin broke resistance area - Likely to rise to resistance level…

31 minutes ago

NZDJPY Wave Analysis – 14 January 2026

NZDJPY: ⬇️ Sell - NZDJPY reversed down from the resistance area - Likely to fall…

32 minutes ago

The dollar does not tolerate dissent

US GDP growth is driven not by the White House, but by AI. The Bank…

11 hours ago

The crypto market has made a breakthrough

The crypto market surges, hitting new highs, with bullish sentiment for Bitcoin and Ethereum amid…

11 hours ago

Brent Crude oil Wave Analysis – 13 January 2026

Brent Crude oil ⬆️ Buy - Brent Crude oil rising inside impulse wave c -…

1 day ago

USDJPY Wave Analysis – 13 January 2026

USDJPY ⬆️ Buy - USDJPY broke resistance area - Likely to rise to resistance level…

1 day ago

This website uses cookies