Categories: Technical analysis

GBPNZD Wave Analysis – 17 August, 2022

• GBPNZD broke key resistance level 1.9100

• Likely to rise to resistance level 1.9270

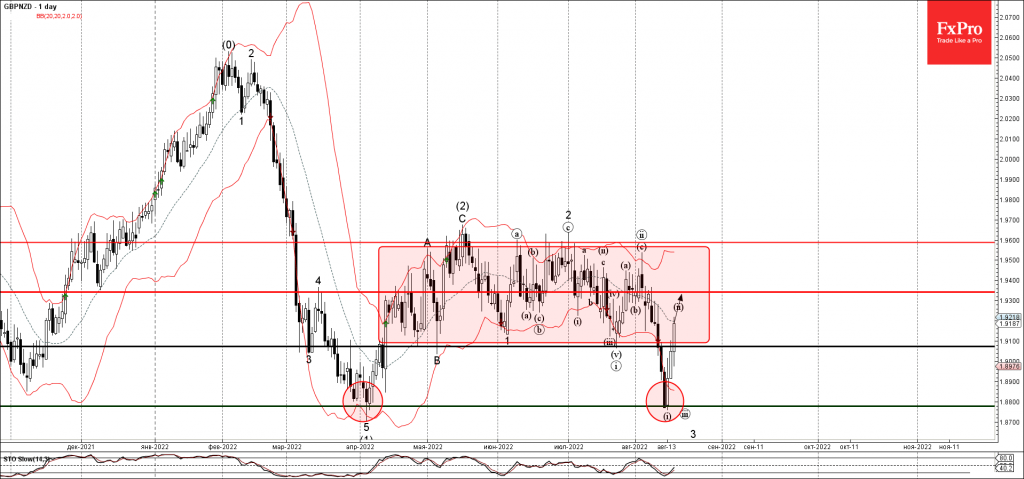
GBPNZD recently broke above the key resistance level 1.9100 (former lower boundary of the sideways price range inside which the pair has been trading from the middle of April).

The breakout of the resistance level 1.9100 accelerated the active short-term ABC correction (ii).

Given the bullish sterling sentiment seen today, GBPNZD can be expected to rise further toward the next resistance level 1.9270 (middle of the aforementioned sideways price range and the target for the completion of the active wave (ii)).

The FxPro Tech Analysis Team

The FxPro technical experts prepare a daily analysis of the most active currency pairs (majors, crosses, exotics) and commodities. Selected instruments are reviewed on daily trends (D1, H4), using the active Elliott Wave setups, Japanese candlesticks, indicators, and support/resistance levels.

Share
Published by
The FxPro Tech Analysis Team
Tags: GBPNZD

Recent Posts

Europe’s Growth Stalls Again as the Euro Enters Correction Mode

Eurozone business activity slows as falling orders and declining confidence impact growth. Manufacturing PMI remains…

2 hours ago

The Rapid Assault on Crypto

The cryptocurrency market experienced a significant surge, with market capitalisation reaching $2.95 trillion. Bitcoin is…

6 hours ago

Bitcoin Wave Analysis – 22 April 2025

Bitcoin: ⬆️ Buy - Bitcoin broke round resistance level 90000.00 - Likely to rise to…

20 hours ago

AUDUSD Wave Analysis – 22 April 2025

AUDUSD: ⬇️ Sell - AUDUSD reversed from the key resistance level 0.6400 - Likely to…

20 hours ago

Crypto Market Escapes from Fear

Market Overview The crypto market has gained around 2% over the past seven days, with…

1 day ago

Nike Wave Analysis – 21 April 2025

Nike: ⬆️ Buy - Nike reversed from the long-term support level 52.60 - Likely to…

2 days ago