Categories: Technical analysis

GBPNZD Wave Analysis – 16 April, 2020

  • GBPNZD approached resistance area
  • Likely to fall to 2.0730

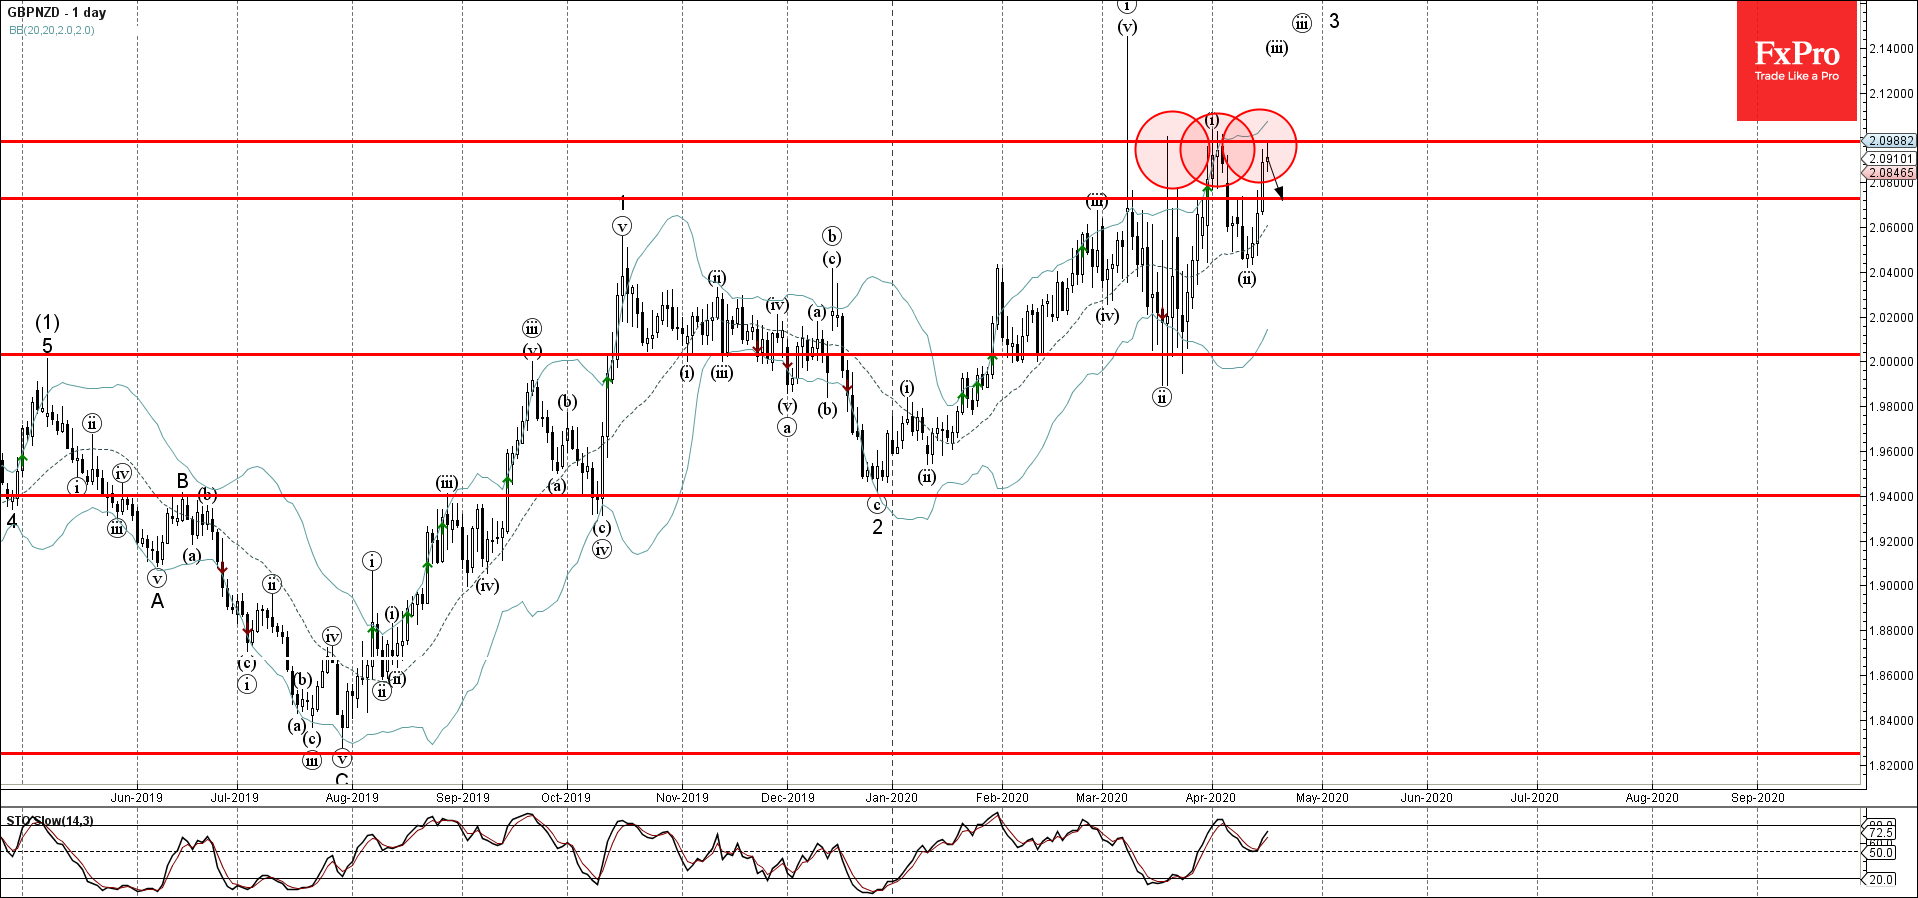
GBPNZD is currently trading near the resistance area lying between the key resistance level 2.0980 (which has been reversing the price from the middle of March) – strengthened by the upper daily Bollinger Band.

This resistance area earlier stopped the previous short-term impulse wave (i) at the end of last month.

If the pair does not break above the resistance level 2.0980 – GBPNZD can then fall to the next support level 2.0730. In the alternative scenario the price can rise up to 2.1200.

The FxPro Tech Analysis Team

The FxPro technical experts prepare a daily analysis of the most active currency pairs (majors, crosses, exotics) and commodities. Selected instruments are reviewed on daily trends (D1, H4), using the active Elliott Wave setups, Japanese candlesticks, indicators, and support/resistance levels.

Share
Published by
The FxPro Tech Analysis Team
Tags: GBPNZD

Recent Posts

Nikkei 225 index Wave Analysis 20 September 2024

- Nikkei 225 index rising inside minor impulse waves 3 - Likely to reach resistance…

13 hours ago

NZDJPY Wave Analysis 20 September 2024

- NZDJPY rising inside corrective wave ii - Likely to rise to resistance level 91.65…

13 hours ago

Gold terminates the last sceptics

Gold started the week with new highs and ended the week up 1.3%, despite a…

19 hours ago

The Crypto Market’s Steady Ascent

Crypto market cap rose by 3.2% to $2.21 trillion overnight. This made the struggle to…

1 day ago

Gold Wave Analysis 19 September 2024

- Gold reversed from support level 2550.00 - Likely to rise to resistance level 2600.00…

1 day ago

S&P 500 Wave Analysis 19 September 2024

- S&P 500 broke key resistance level 5670.00 - Likely to rise to resistance level…

1 day ago

This website uses cookies