Categories: Technical analysis

GBPJPY Wave Analysis 10 November, 2020

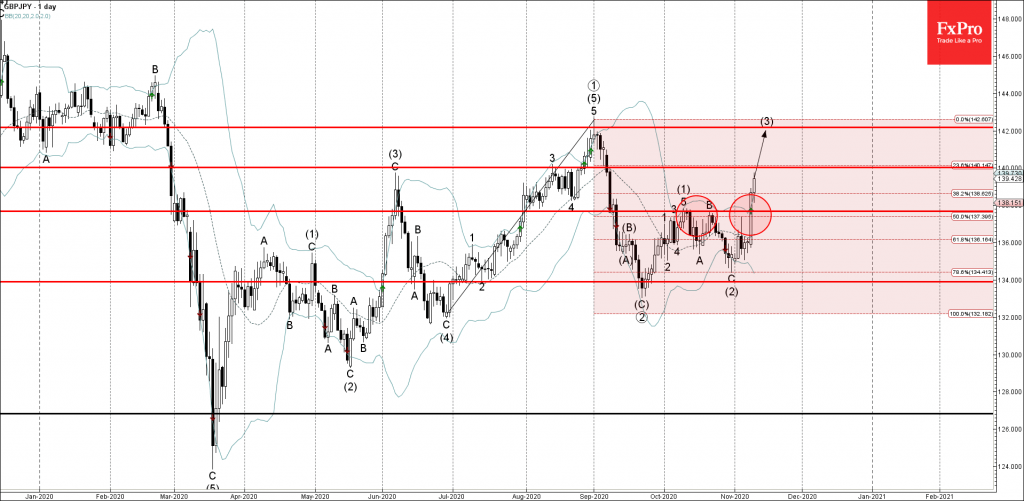
• GBPJPY broke resistance level 137.65

• Likely to rise to 140.00

GBPJPY recently broke the key resistance level 137.65 (which reversed the price twice in October) – standing close to the 50% Fibonacci correction of the pervious downward correction from August.

The breakout of the resistance level 137.65 accelerated the active medium-term upward impulse wave (3) from the end of last month.

Given the predominant sterling bullishness – GBPJPY is likely to rise further toward the next round resistance level 140.00 – the breakout of which can lead to further gains toward 142.00 (target for the completion of the active wave (3)).

The FxPro Tech Analysis Team

The FxPro technical experts prepare a daily analysis of the most active currency pairs (majors, crosses, exotics) and commodities. Selected instruments are reviewed on daily trends (D1, H4), using the active Elliott Wave setups, Japanese candlesticks, indicators, and support/resistance levels.

Share
Published by
The FxPro Tech Analysis Team

Recent Posts

Gold Wave Analysis – 12 December 2025

Gold: ⬇️ Sell - Gold reversed from strong resistance level 4350.00 - Likely to fall to…

2 days ago

EURGBP Wave Analysis – 12 December 2025

EURGBP: ⬆️ Buy - EURGBP reversed from support zone - Likely to rise to resistance level…

2 days ago

Filecoin Wave Analysis – 12 December 2025

Filecoin: ⬇️ Sell - Filecoin broke key support level 1.435 - Likely to fall to support…

2 days ago

Ethereum Wave Analysis – 12 December 2025

Ethereum: ⬇️ Sell - Ethereum reversed from resistance level 3400.00 - Likely to fall to support…

2 days ago

Pro News Weekly: Global Markets at a Turning Point

Welcome to Pro News Weekly! Here’s what is moving the markets: 💵 The Fed fails…

3 days ago

Crypto: slight rebound within a bear market

Crypto rebounds slightly in a bear market; resistance holds, optimism rises, but the outlook remains…

3 days ago

This website uses cookies