Categories: Technical analysis

GBPCHF Wave Analysis – 4 August 2025

GBPCHF: ⬆️ Buy

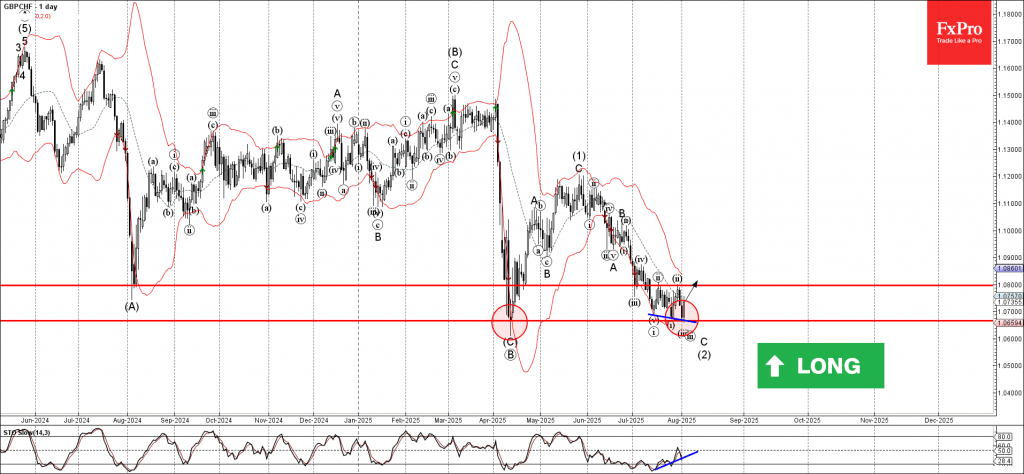
– GBPCHF reversed from key support level 1.0665

– Likely to rise to the resistance level 1.0800

GBPCHF currency pair recently reversed from the support zone between the pivotal support level 1.0665 (former strong support from April) and the lower daily Bollinger Band.

The upward reversal from this support zone will likely form the daily Japanese candlesticks reversal pattern Bullish Engulfing, if the pair closes today near the current levels.

Given the strength of the support level 1.0665 and the bullish divergence on the daily Stochastic, GBPCHF can be expected to rise to the next resistance level 1.0800 (which stopped earlier corrections (ii) and ii).

The FxPro Tech Analysis Team

The FxPro technical experts prepare a daily analysis of the most active currency pairs (majors, crosses, exotics) and commodities. Selected instruments are reviewed on daily trends (D1, H4), using the active Elliott Wave setups, Japanese candlesticks, indicators, and support/resistance levels.

Share
Published by
The FxPro Tech Analysis Team
Tags: GBPCHF

Recent Posts

Platinum Wave Analysis – 8 January 2026

Platinum: ⬇️ Sell - Platinum reversed from pivotal resistance level 150.00 - Likely to fall to…

3 hours ago

Baidu Wave Analysis – 8 January 2026

Baidu: ⬇️ Sell - Baidu reversed from resistance zone - Likely to fall to support level…

3 hours ago

EURUSD Wave Analysis – 8 January 2026

EURUSD: ⬇️ Sell - EURUSD broke daily up channel - Likely to fall to support…

5 hours ago

WTI crude oil Wave Analysis – 8 January 2026

WTI crude oil: ⬆️ Buy - WTI crude oil reversed from support zone - Likely…

5 hours ago

Do not underestimate dollar

Positive macro statistics for the US are helping the greenback. Gold could rise to $4,610…

12 hours ago

Crypto fails to find support for a breakout

Crypto markets fell amid caution; Bitcoin and Ethereum face technical and investor shifts, with privacy…

13 hours ago

This website uses cookies