Categories: Technical analysis

GBPCHF Wave Analysis 4 August 2023

– GBPCHF reversed from powerful support level 1.2600

– Likely to rise to resistance at 1.1230

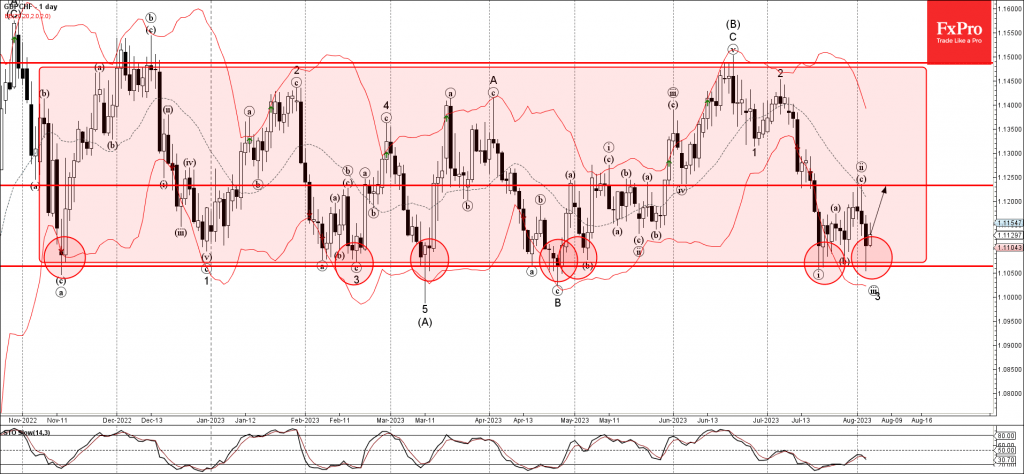
GBPCHF recently reversed up from the powerful support level 1.2600, which is the lower boundary of the wide sideways price range from last November.

The support level 1.2600 was strengthened by the lower daily Bollinger Band.

Given the strength of the support level 1.2600 and the bullish divergence on the daily Stochastics, GBPCHF can be expected to rise further toward the next resistance at 1.1230 (top of the previous correction ii).

The FxPro Tech Analysis Team

The FxPro technical experts prepare a daily analysis of the most active currency pairs (majors, crosses, exotics) and commodities. Selected instruments are reviewed on daily trends (D1, H4), using the active Elliott Wave setups, Japanese candlesticks, indicators, and support/resistance levels.

Share
Published by
The FxPro Tech Analysis Team
Tags: GBPCHF

Recent Posts

GBPUSD. Current situation #tradelikeapro #trading #tradingstrategy #tradingshorts #gbpusd #gbp

Today is Thursday, the 18th of December, and we'll be talking about the British pound…

3 hours ago

Bitcoin is holding, while Solana is on the edge

Bitcoin remains stable near $87K, outperforming altcoins, while Solana faces key support at $120. Institutional…

5 hours ago

The dollar’s wings have been clipped

Waller's dovish rhetoric halted the bears' attack on EURUSD. Slowing UK inflation caused the pound…

5 hours ago

Dow Jones Wave Analysis – 17 December 2025

Dow Jones: ⬇️ Sell - Dow Jones reversed from resistance level 49000.00 - Likely to fall…

21 hours ago

Comcast Wave Analysis – 17 December 2025

Comcast: ⬆️ Buy - Comcast broke resistance area - Likely to rise to resistance level 31.00…

21 hours ago

Platinum Wave Analysis – 17 December 2025

Platinum: ⬆️ Buy - Platinum broke resistance level 1800.00 - Likely to rise to resistance…

22 hours ago

This website uses cookies