Categories: Technical analysis

GBPCHF Wave Analysis 26 March, 2021

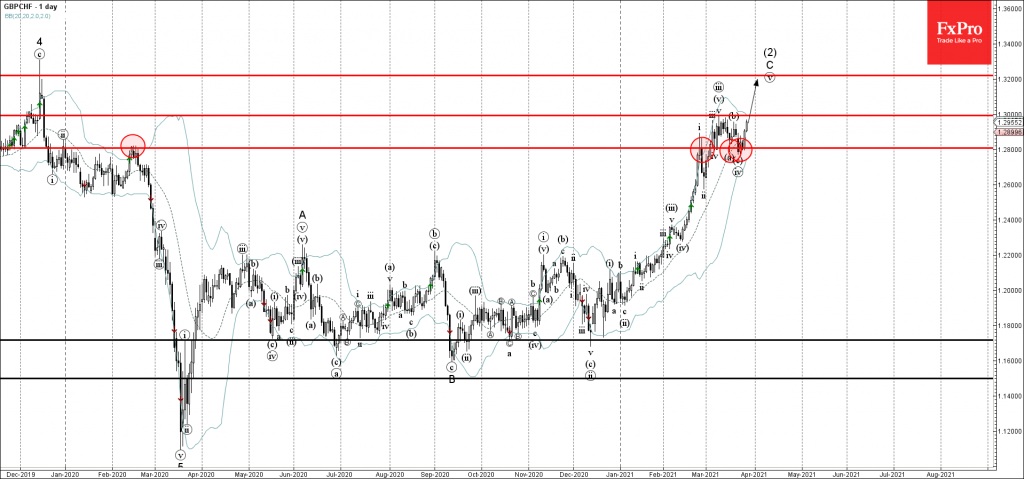
• GBPCHF reversed from support level 1.2800

• Likely to rise to resistance level 1.3000

GBPCHF continues to rise inside the accelerated impulse wave (v) which started earlier from the support level 1.2800 standing near the lower daily Bollinger Band.

The active impulse wave (v) belongs to the sharp upward impulse wave C of the ABC correction (2) from March of 2020.

GBPCHF is likely to rise further toward the next resistance level 1.3000 (top of the impulse wave (iii)) – followed by the resistance level 1.3200 (target for the completion of wave C).  

The FxPro Tech Analysis Team

The FxPro technical experts prepare a daily analysis of the most active currency pairs (majors, crosses, exotics) and commodities. Selected instruments are reviewed on daily trends (D1, H4), using the active Elliott Wave setups, Japanese candlesticks, indicators, and support/resistance levels.

Share
Published by
The FxPro Tech Analysis Team
Tags: GBPCHF

Recent Posts

Crypto Market Retreats Due to Overhang of Sellers

Market picture The crypto market has lost 3.3% in the last 24 hours to $2.3…

42 mins ago

USDJPY Wave Analysis 26 April 2024

- USDJPY broke key resistance level 155.00 - Likely to rise to resistance level 160.00…

3 days ago

Ebay Wave Analysis 26 April 2024

- Ebay reversed from support level 49.35 - Likely to rise to resistance level 52.55…

3 days ago

False Alert with Yen Interventions?

Even though the Bank of Japan left the key rate and parameters of the QE…

3 days ago

Cooler Bitcoin

Market picture  Market Dynamics: The cryptocurrency market stabilised, losing just 0.1% of capitalisation and dropping to…

3 days ago

GBPCAD Wave Analysis 25 April 2024

- GBPCAD reversed from key support level 1.6910 - Likely to rise to resistance level…

4 days ago

This website uses cookies