Categories: Technical analysis

GBPCHF Wave Analysis 23 October, 2020

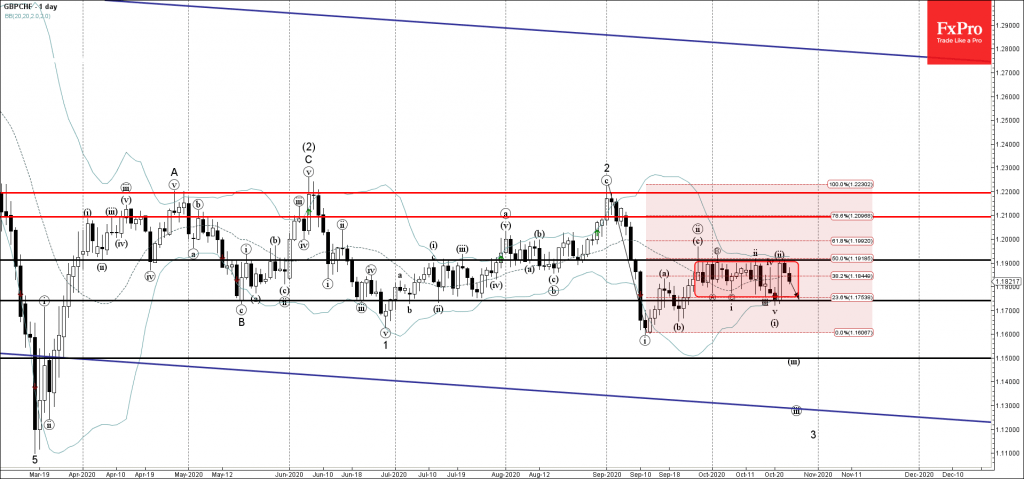
• GBPCHF reversed from resistance level 1,1900

• Likely to fall to 1,1740

GBPCHF recently reversed down from the resistance level 1,1900 (which is the upper boundary of the sideways price range inside which the pair has been trading from last month).

The resistance area near the resistance level 1,1900 is strengthened by the upper daily Bollinger Band and by the 50% Fibonacci retracement of the downward impulse (i) from the start of September

GBPCHF is likely to fall further toward the next support level 1,1740 (lower boundary of the aforementioned price range).

The FxPro Tech Analysis Team

The FxPro technical experts prepare a daily analysis of the most active currency pairs (majors, crosses, exotics) and commodities. Selected instruments are reviewed on daily trends (D1, H4), using the active Elliott Wave setups, Japanese candlesticks, indicators, and support/resistance levels.

Share
Published by
The FxPro Tech Analysis Team

Recent Posts

ADP hints at another strong NFP on Friday  

The monthly ADP labour market report showed that America created 192K new jobs in April, above…

23 hours ago

Fed’s hawkish tone risks sinking S&P500 to 4700

Bears showed strength ahead of the FOMC decision.  U.S. indices sagged on Tuesday as investors…

1 day ago

A new stage of Bitcoin’s decline

Market Picture  Bitcoin's closing price on Tuesday became the lowest since late February, confirming the…

1 day ago

Ebay Wave Analysis 30 April 2024

- Ebay under the bearish pressure - Likely to fall to support level 51.00 Ebay…

2 days ago

GBPAUD Wave Analysis 30 April 2024

- GBPAUD reversed from key support level 1.9135 - Likely to rise to resistance level…

2 days ago

Silver: a possible long road down

Silver has lost 2.6% since the start of the day on Tuesday to $26.4 per…

2 days ago

This website uses cookies