Categories: Technical analysis

GBPCHF Wave Analysis 23 February, 2021

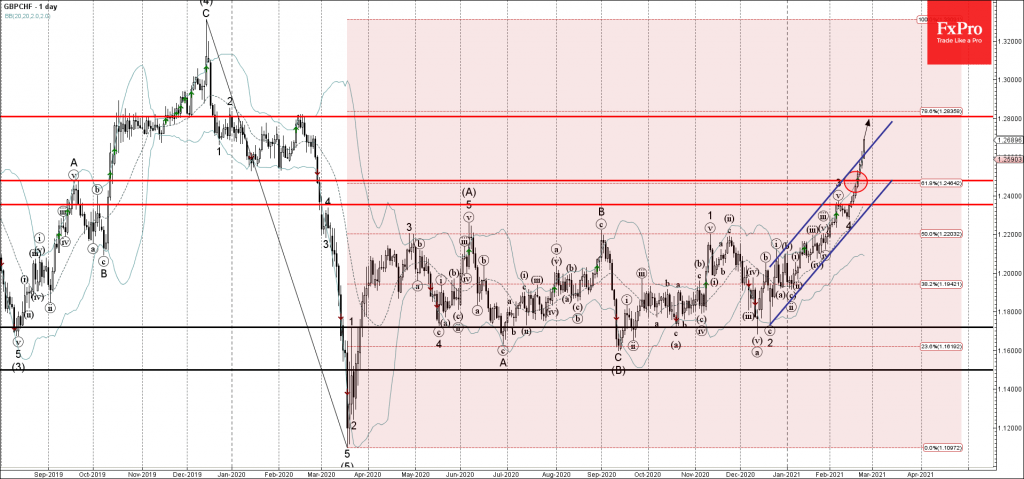
• GBPCHF broke resistance level 1.2480

• Likely to reach resistance 1.2800

GBPCHF continues to rise strongly after the pair broke the resistance level 1.2480, intersecting with the 61.8% Fibonacci correction of the previous downward impulse from December.

The breakout of the resistance level 1.2480 accelerated the active impulse wave 3 – which then broke the daily up channel from December.

GBPCHF can be expected to rise further toward the next support resistance 1.2800 (former monthly high from February of 2020).

AddThis Website Tools
The FxPro Tech Analysis Team

The FxPro technical experts prepare a daily analysis of the most active currency pairs (majors, crosses, exotics) and commodities. Selected instruments are reviewed on daily trends (D1, H4), using the active Elliott Wave setups, Japanese candlesticks, indicators, and support/resistance levels.

Share
Published by
The FxPro Tech Analysis Team
Tags: GBPCHF

Recent Posts

NIO Wave Analysis – 31 March 2025

NIO: ⬆️ Buy - NIO reversed from support zone - Likely to rise to resistance…

7 hours ago

Nvidia Wave Analysis – 31 March 2025

Nvidia: ⬆️ Buy - Nvidia reversed from key support level 105.00 - Likely to rise…

7 hours ago

Markets rattled on consumer sentiment

Consumer sentiment index from the University of Michigan shows alarming information for stock indices, with…

14 hours ago

EURAUD Wave Analysis – 31 March 2025

EURAUD: ⬆️ Buy - EURAUD rising inside impulse wave iii - Likely to reach resistance…

14 hours ago

USDCAD Wave Analysis – 31 March 2025

USDCAD: ⬆️ Buy - USDCAD reversed from the support zone - Likely to rise to…

14 hours ago

Video Pro News Weekly: Market Shake-Up. USD Struggles & Crypto’s Next Big Move!

Major market shifts underway! The US dollar hits resistance, stocks teeter on tariff tensions, and…

18 hours ago