Categories: Technical analysis

GBPCHF Wave Analysis 22 January, 2021

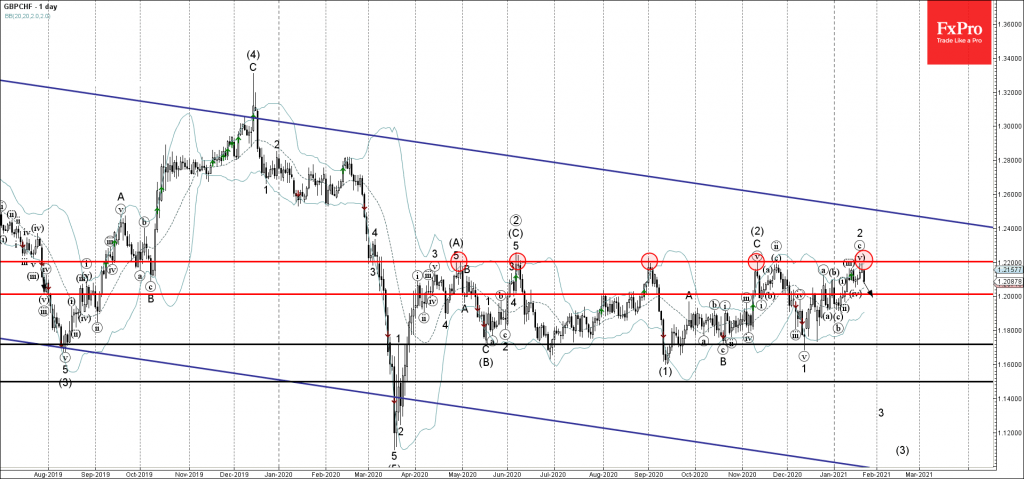
• GBPCHF reversed from long-term resistance level 1.2200

• Likely to fall to 1.2000

GBPCHF recently reversed down from the long-term resistance level 1.2200 (which has been reversing the price from the end of November) – standing near the lower daily Bollinger Band.

The downward reversal from this resistance level will most likely form the daily Morning Star candlesticks reversal pattern – if the price closes today near the current levels – which is a strong sell signal for this currency pair.

GBPCHF is expected to fall further in the active impulse waves 3 and (3) toward the next round support level 1.2000.

The FxPro Tech Analysis Team

The FxPro technical experts prepare a daily analysis of the most active currency pairs (majors, crosses, exotics) and commodities. Selected instruments are reviewed on daily trends (D1, H4), using the active Elliott Wave setups, Japanese candlesticks, indicators, and support/resistance levels.

Share
Published by
The FxPro Tech Analysis Team
Tags: GBPCHF

Recent Posts

The dollar does not tolerate dissent

US GDP growth is driven not by the White House, but by AI. The Bank…

7 hours ago

The crypto market has made a breakthrough

The crypto market surges, hitting new highs, with bullish sentiment for Bitcoin and Ethereum amid…

8 hours ago

Brent Crude oil Wave Analysis – 13 January 2026

Brent Crude oil ⬆️ Buy - Brent Crude oil rising inside impulse wave c -…

21 hours ago

USDJPY Wave Analysis – 13 January 2026

USDJPY ⬆️ Buy - USDJPY broke resistance area - Likely to rise to resistance level…

21 hours ago

Exxon Mobil Wave Analysis – 13 January 2026

Exxon Mobil ⬆️ Buy - Exxon Mobil broke resistance level 125.60 - Likely to rise…

21 hours ago

BNB Wave Analysis – 13 January 2026

Brent Crude oil ⬆️ Buy - BNB broke out of sideways price range - Likely…

21 hours ago

This website uses cookies