Categories: Technical analysis

GBPCHF Wave Analysis – 22 April, 2020

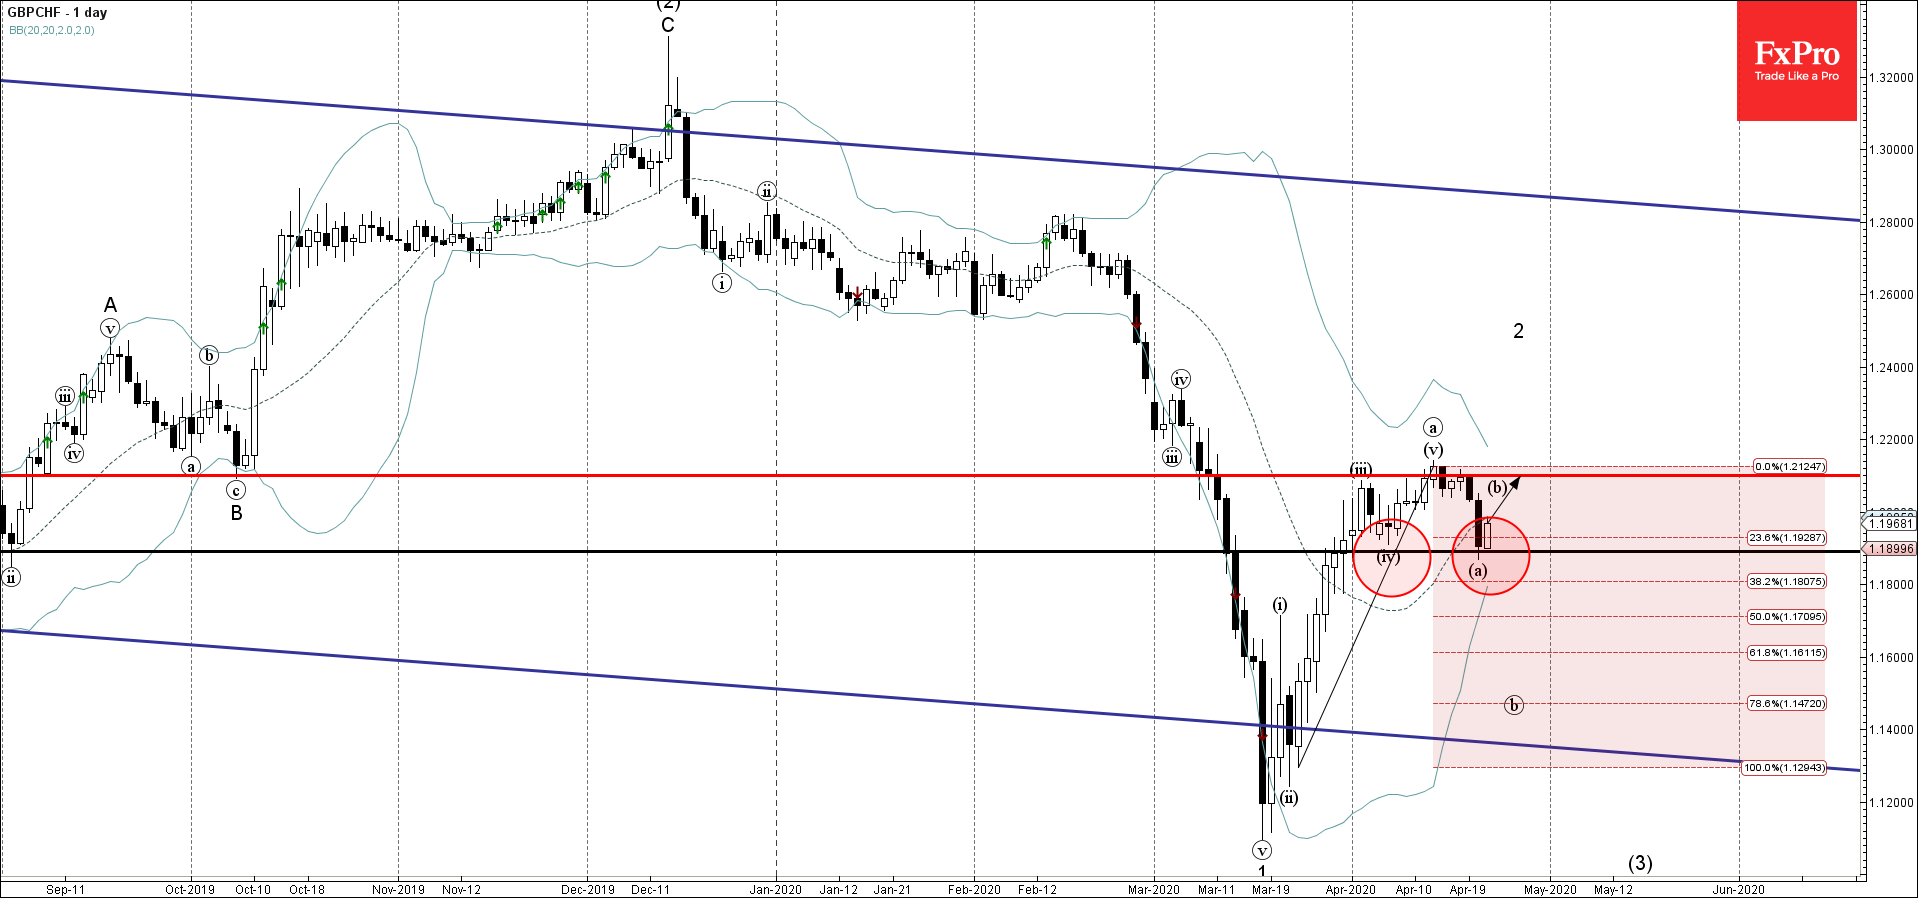
  • GBPCHF reversed from support area
  • Likely to rise to 1.2100

GBPCHF recently reversed up from the support area lying between the round support level 1.900 (which was set as the likely downward target in our previous forecast for this currency pair) and the lower daily Bollinger Band.

The upward reversal from this support area started the active short-term correction (b).

GBPCHF is expected to rise further toward the next resistance level 1.2100 (which reversed the earlier wave (a) and which is also the target for the completion of the active wave (b))


The FxPro Tech Analysis Team

The FxPro technical experts prepare a daily analysis of the most active currency pairs (majors, crosses, exotics) and commodities. Selected instruments are reviewed on daily trends (D1, H4), using the active Elliott Wave setups, Japanese candlesticks, indicators, and support/resistance levels.

Share
Published by
The FxPro Tech Analysis Team
Tags: GBPCHF

Recent Posts

EURUSD at the equilibrium, where will it go next? 

The single currency is trading near $1.076, waiting for further cues and facing serious resistance…

5 hours ago

Bitcoin can’t accelerate but won’t give up trying

Market picture  The crypto market capitalisation fell by 1.7% in 24 hours to $2.29 trillion,…

10 hours ago

USDJPY Wave Analysis 6 May 2024

- USDJPY reversed from support zone - Likely to rise to resistance level 155.65 USDJPY…

1 day ago

Gold Wave Analysis 6 May 2024

- Gold reversed from support zone - Likely to rise to resistance level 2400.00 Gold…

1 day ago

Oil Bounces Locally, Global Support 5% below Spot Price

The number of operating oil rigs in the US fell by 7 to 499. This…

1 day ago

Crypto Market Tries to Break Local Downtrend

Market picture  Crypto market capitalisation has been up 2% over the past seven days and…

1 day ago

This website uses cookies