Categories: Technical analysis

GBPCHF Wave Analysis – 20 April, 2020

  • GBPCHF broke resistance zone
  • Likely to fall to 1.1890

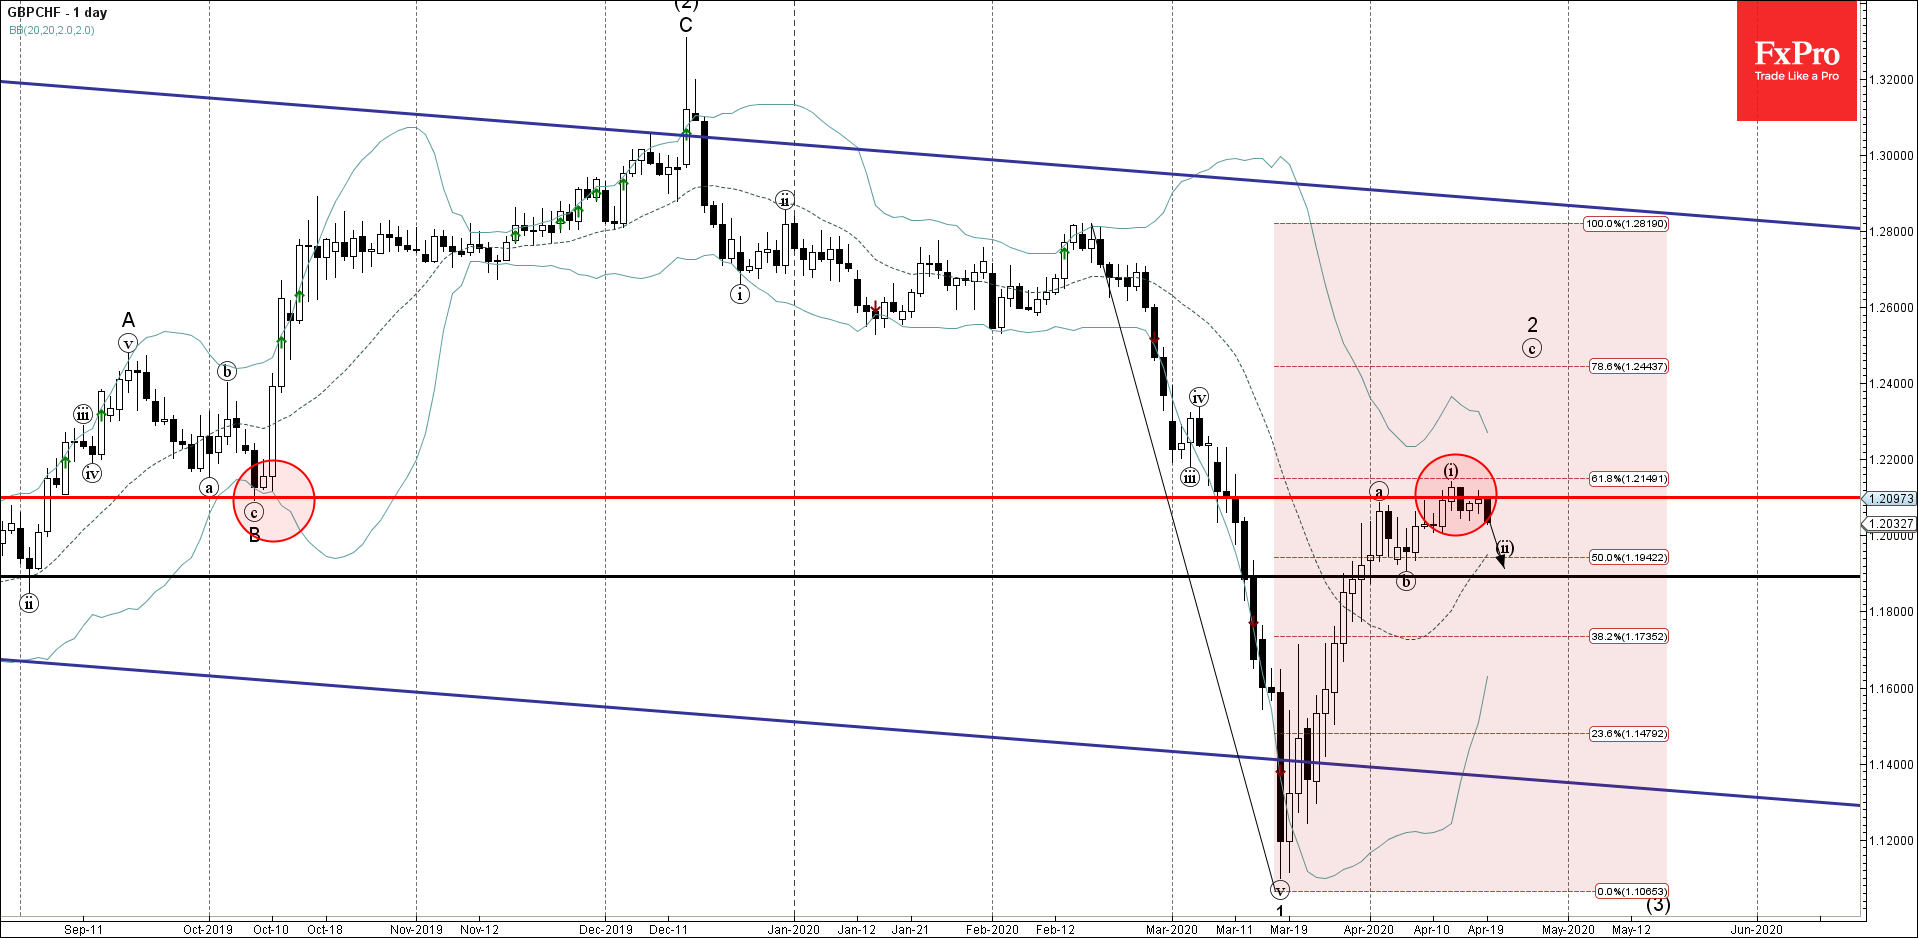
GBPCHF recently reversed down from the resistance area located between the key resistance level 1.2100 (former strong support from October) and the 61.8% Fibonacci correction of the downward impulse from the middle of February.

The downward reversal from this resistance zone started the active minor corrective wave (ii) of the ©-wave from the start of April.

GBPCHF is expected to fall further toward the next support level 1.1890 (low of the earlier correction (b) and target price for the completion of the active wave (ii)).

The FxPro Tech Analysis Team

The FxPro technical experts prepare a daily analysis of the most active currency pairs (majors, crosses, exotics) and commodities. Selected instruments are reviewed on daily trends (D1, H4), using the active Elliott Wave setups, Japanese candlesticks, indicators, and support/resistance levels.

Share
Published by
The FxPro Tech Analysis Team
Tags: GBPCHF

Recent Posts

Gold shines on an anti-fiat thesis

The dollar suffered due to threats to the Fed’s independence. Gold managed to renew its…

1 hour ago

SP500 Current situation #trading #tradelikeapro #sp500 #tradingshorts #tradingstrategy

Today is Monday, the 12th of January, and once again we will talk about the…

2 hours ago

Crypto: sell-the-growth continues

Crypto markets remain volatile; Bitcoin faces selling pressure, XRP slips, Monero surges, and market signals…

3 hours ago

CHFJPY Wave Analysis – 9 January 2026

CHFJPY: ⬆️ Buy - CHFJPY reversed from support area - Likely to rise to resistance…

3 days ago

Exxon Mobil Wave Analysis – 9 January 2026

Exxon Mobil: ⬆️ Buy - Exxon Mobil reversed from support area - Likely to rise…

3 days ago

Pro News Weekly: Dollar Rebounds as Markets Test New Limits

Welcome to Pro News Weekly! Here’s what is shaping the markets: 💵 The U.S. dollar…

3 days ago

This website uses cookies