Categories: Technical analysis

GBPCHF Wave Analysis 2 October 2023

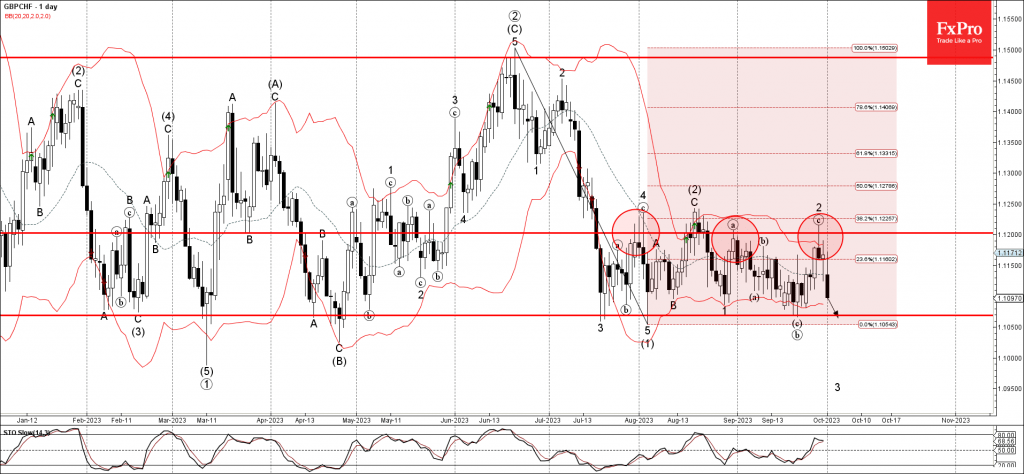
– GBPCHF reversed from resistance level 1.1200

– Likely to fall to support level 1.1070

GBPCHF currency pair earlier reversed down from the key resistance level 1.1200 (which has been reversing the pair from July) intersecting with the upper weekly Bollinger Band and the 38.2% Fibonacci correction of the downward impulse (1) from June.

The downward reversal from the resistance level 1.1200 started the active short-term impulse wave 3.

Given the strength of the Swiss franc inflows, GBPCHF can be expected to fall further toward the next support level 1.1070 (which has been reversing the pair from April).

The FxPro Tech Analysis Team

The FxPro technical experts prepare a daily analysis of the most active currency pairs (majors, crosses, exotics) and commodities. Selected instruments are reviewed on daily trends (D1, H4), using the active Elliott Wave setups, Japanese candlesticks, indicators, and support/resistance levels.

Share
Published by
The FxPro Tech Analysis Team
Tags: GBPCHF

Recent Posts

EURCAD Wave Analysis 6 September 2024

- EURCAD reversed from pivotal support level 1.4900 - Likely to rise to resistance level…

1 day ago

EURUSD Wave Analysis 6 September 2024

- EURUSD reversed from support level 1.1030 - Likely to rise to resistance level 1.1200…

1 day ago

Further Unwinding of Carry Trade

The unwinding of the carry trade in the FX market continues, with the major safe…

1 day ago

Bitcoin pressured by risk-off mood

Market Picture The pressure on risk assets continues, pushing the crypto market capitalisation back below…

2 days ago

AUDUSD Wave Analysis 5 September 2024

- AUDUSD reversed from support level 0.6700 - Likely to rise to resistance level 0.6800…

2 days ago

Gold Wave Analysis 5 September 2024

- Gold reversed from support level 2475.00 - Likely to rise to resistance level 2535.00…

2 days ago

This website uses cookies