Categories: Technical analysis

GBPCHF Wave Analysis 2 December, 2020

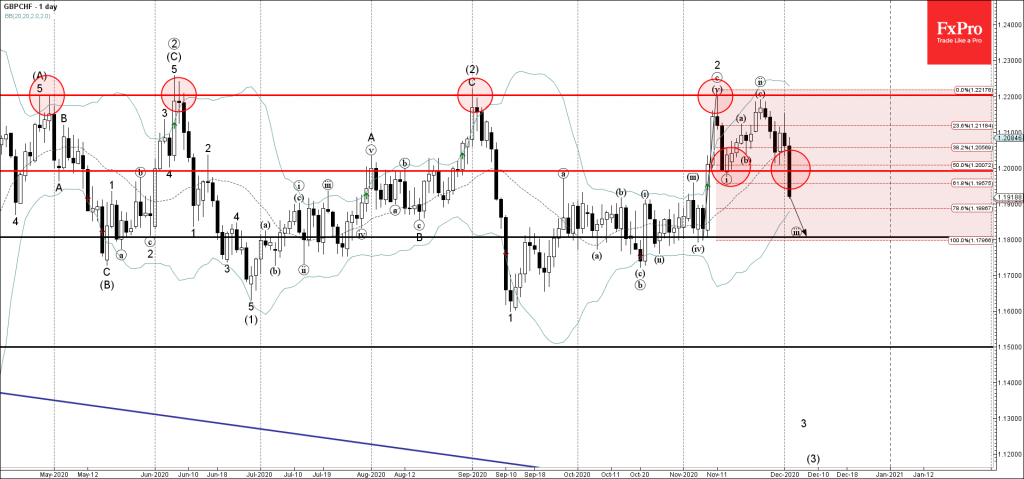
• GBPCHF broke round support level 1.2000

• Likely to fall to 1.1800

GBPCHF recently broke the round support level 1.2000 (low of the previous minor impulse wave (i)) intersecting with the 50% Fibonacci correction level of the previous sharp upward impulse from the start of November.

The breakout of the support level 1.2000 accelerated the active short-term impulse wave (iii), which started earlier from the powerful resistance level 1.2200.

GBPCHF is expected to fall further toward the next support level 1.1800 (target price for the completion of the active impulse wave (iii)).

The FxPro Tech Analysis Team

The FxPro technical experts prepare a daily analysis of the most active currency pairs (majors, crosses, exotics) and commodities. Selected instruments are reviewed on daily trends (D1, H4), using the active Elliott Wave setups, Japanese candlesticks, indicators, and support/resistance levels.

Share
Published by
The FxPro Tech Analysis Team

Recent Posts

The dollar does not tolerate dissent

US GDP growth is driven not by the White House, but by AI. The Bank…

3 hours ago

The crypto market has made a breakthrough

The crypto market surges, hitting new highs, with bullish sentiment for Bitcoin and Ethereum amid…

3 hours ago

Brent Crude oil Wave Analysis – 13 January 2026

Brent Crude oil ⬆️ Buy - Brent Crude oil rising inside impulse wave c -…

17 hours ago

USDJPY Wave Analysis – 13 January 2026

USDJPY ⬆️ Buy - USDJPY broke resistance area - Likely to rise to resistance level…

17 hours ago

Exxon Mobil Wave Analysis – 13 January 2026

Exxon Mobil ⬆️ Buy - Exxon Mobil broke resistance level 125.60 - Likely to rise…

17 hours ago

BNB Wave Analysis – 13 January 2026

Brent Crude oil ⬆️ Buy - BNB broke out of sideways price range - Likely…

17 hours ago

This website uses cookies