Categories: Technical analysis

GBPCHF Wave Analysis 16 February, 2021

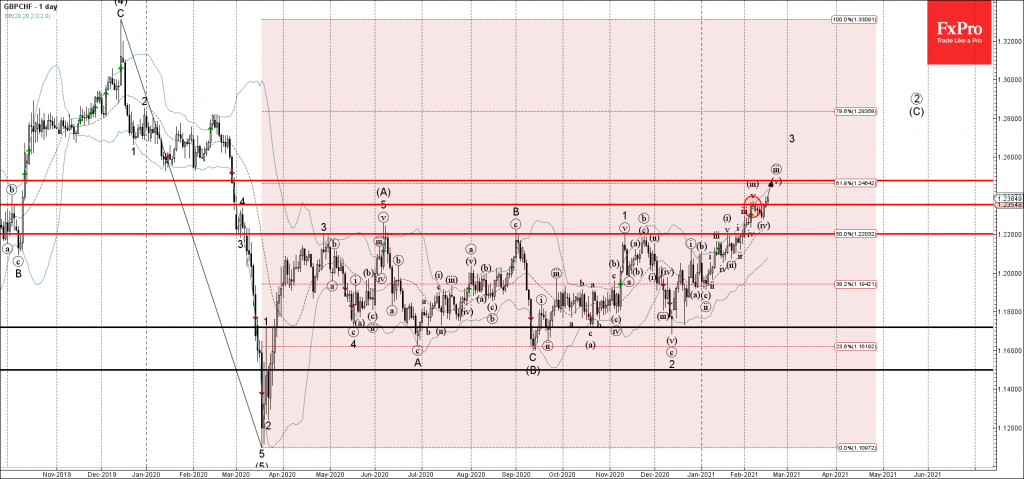
• GBPCHF under bullish pressure

• Likely to reach resistance level 1.2480

GBPCHF under bullish pressure as the result of the earlier breakout of the resistance level 1.2350 (which stopped the previous short-term impulse wave (iii) at the start of February).

The breakout of the resistance level 1.2350 accelerated the active impulse waves 3 and (iii) of the multi-month upward impulse sequence (C) from last September.

Given the clear daily uptrend – GBPCHF is likely to rise further toward the next resistance level 1.2480 (forecast price for the termination of the active minor impulse wave (iii)).

The FxPro Tech Analysis Team

The FxPro technical experts prepare a daily analysis of the most active currency pairs (majors, crosses, exotics) and commodities. Selected instruments are reviewed on daily trends (D1, H4), using the active Elliott Wave setups, Japanese candlesticks, indicators, and support/resistance levels.

Share
Published by
The FxPro Tech Analysis Team
Tags: GBPCHF

Recent Posts

Adobe Wave Analysis 3 May 2024

- Adobe reversed from support zone - Likely to rise to resistance level 500.00 Adobe…

1 day ago

EURGBP Wave Analysis 3 May 2024

- EURJPY reversed from support zone - Likely to rise to resistance level 0.8625 EURGBP…

1 day ago

How Low Can the USDJPY Go?

USDJPY was slipping below 153 on Friday morning, a three-week low and having lost over…

1 day ago

Bitcoin’s Downtrend, Solana and Ethereum Form Double Bottom

Market picture  Crypto market capitalisation rose 3.3% in 24 hours to $2.22 trillion. Local capitalisation…

2 days ago

EURJPY Wave Analysis 2 May 2024

- EURJPY under strong bearish pressure - Likely to fall to support level 163.10 EURJPY…

2 days ago

WTI crude oil Wave Analysis 2 May 2024

- WTI broke round support level 80.00 - Likely to fall to support level 76.00…

2 days ago

This website uses cookies