Categories: Technical analysis

GBPCHF Wave Analysis – 13 February 2025

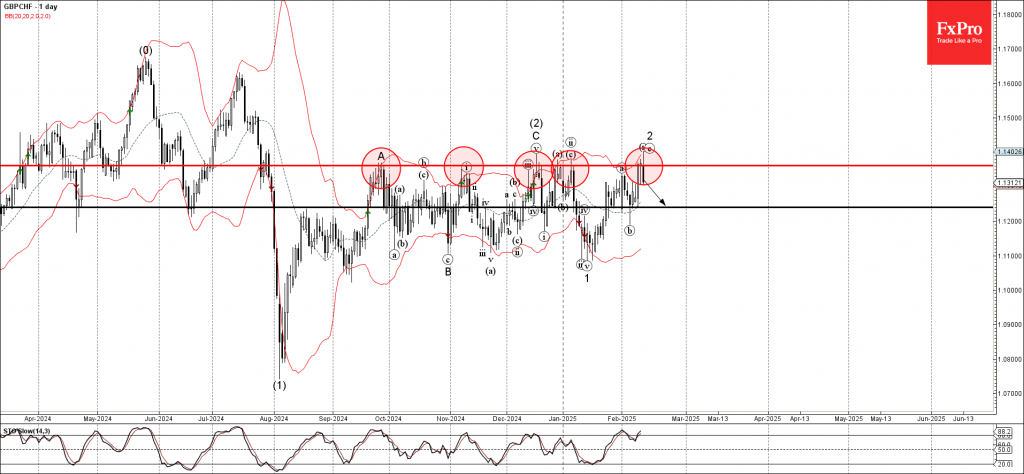
– GBPCHF reversed from the resistance zone

– Likely to fall to support level 1.1240

GBPCHF currency pair recently reversed from the resistance zone between the powerful resistance level 1.1360, (which stopped multiple upward waves from September) and the upper daily Bollinger Band.

The downward reversal from this resistance area created the daily Doji candlesticks pattern, which stopped the previous short-term ABC correction ii from the start of January.

Given the strength of the resistance level 1.1360 and the overbought daily Stochastic, GBPCHF currency pair can be expected to fall to the next support level 1.1240.

AddThis Website Tools
The FxPro Tech Analysis Team

The FxPro technical experts prepare a daily analysis of the most active currency pairs (majors, crosses, exotics) and commodities. Selected instruments are reviewed on daily trends (D1, H4), using the active Elliott Wave setups, Japanese candlesticks, indicators, and support/resistance levels.

Share
Published by
The FxPro Tech Analysis Team
Tags: GBPCHF

Recent Posts

GBPUSD Wave Analysis – 18 March 2025

GBPUSD: ⬆️ Buy - GBPUSD reversed from support zone - Likely to rise to resistance…

1 hour ago

GBPAUD Wave Analysis – 18 March 2025

GBPAUD: ⬆️ Buy - GBPAUD reversed from the support zone - Likely to rise to…

1 hour ago

Solana Wave Analysis – 18 March 2025

Solana: ⬇️ Sell - Solana reversed from the resistance zone - Likely to fall to…

3 hours ago

CHFJPY Wave Analysis – 18 March 2025

CHFJPY: ⬆️ Buy - CHFJPY broke resistance zone - Likely to rise to resistance level…

3 hours ago

The crypto market is stuck in the mud

Market Picture The crypto market has been hovering in a narrow range for the past…

8 hours ago

FTSE 100 Wave Analysis – 17 March 2025

FTSE 100: ⬆️ Buy - FTSE 100 reversed from key support level 8425.00 - Likely…

1 day ago