Categories: Technical analysis

GBPCHF Wave Analysis – 05 September, 2019

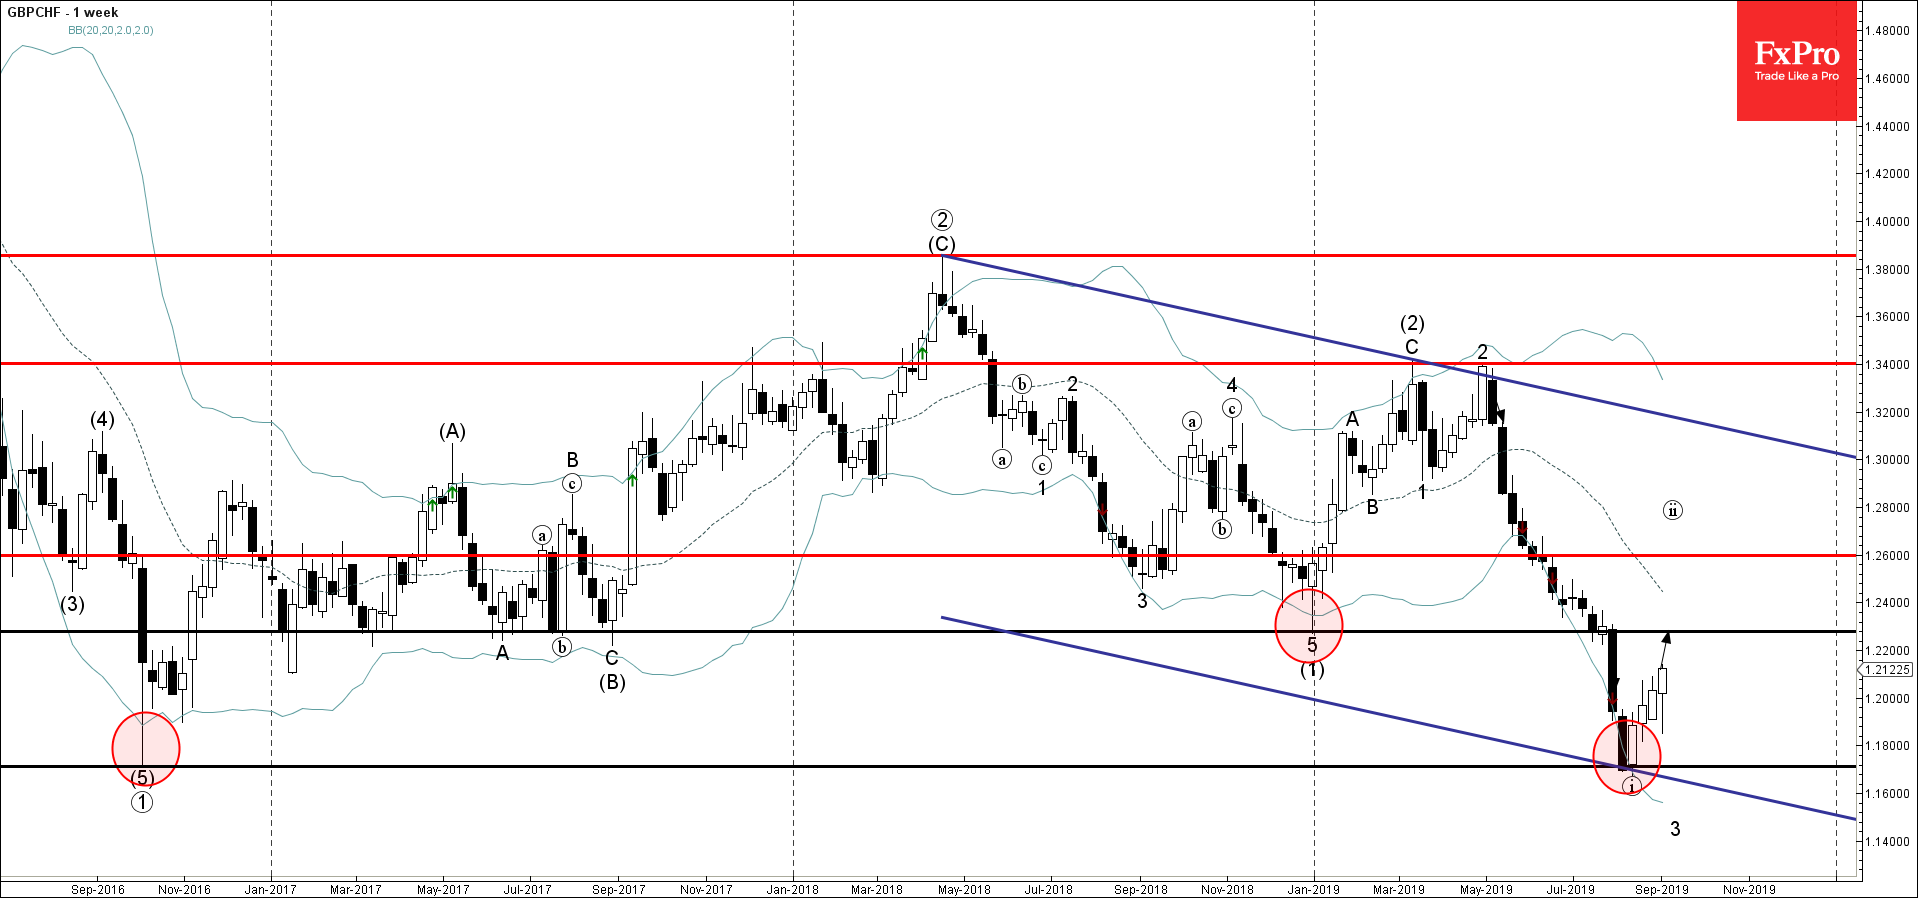
  • GBPCHF rising inside weekly wave (ii)
  • Further gains are likely

GBPCHF continues to rise inside the long-term upward corrective wave (ii) which started recently from the support area lying between the major long-term support level 1.1710 (yearly low from 2016) and the lower weekly Bollinger Band.

The active corrective wave (ii) belongs to the extended weekly downward impulse sequence ③ from the start of 2018.

GBPCHF is expected to rise further and retest the next resistance level 1.2280 (former strong multi-month support level from December).

The FxPro Tech Analysis Team

The FxPro technical experts prepare a daily analysis of the most active currency pairs (majors, crosses, exotics) and commodities. Selected instruments are reviewed on daily trends (D1, H4), using the active Elliott Wave setups, Japanese candlesticks, indicators, and support/resistance levels.

Share
Published by
The FxPro Tech Analysis Team
Tags: GBPCHF

Recent Posts

USDJPY Wave Analysis 26 April 2024

- USDJPY broke key resistance level 155.00 - Likely to rise to resistance level 160.00…

2 days ago

Ebay Wave Analysis 26 April 2024

- Ebay reversed from support level 49.35 - Likely to rise to resistance level 52.55…

2 days ago

False Alert with Yen Interventions?

Even though the Bank of Japan left the key rate and parameters of the QE…

3 days ago

Cooler Bitcoin

Market picture  Market Dynamics: The cryptocurrency market stabilised, losing just 0.1% of capitalisation and dropping to…

3 days ago

GBPCAD Wave Analysis 25 April 2024

- GBPCAD reversed from key support level 1.6910 - Likely to rise to resistance level…

3 days ago

GBPAUD Wave Analysis 25 April 2024

- GBPAUD reversed from support level 1.9135 - Likely to rise to resistance level 1.9360…

3 days ago

This website uses cookies