Categories: Technical analysis

GBPCHF Wave Analysis – 01 April, 2019

  • GBPCHF reversed from support area
  • Further gains are likely

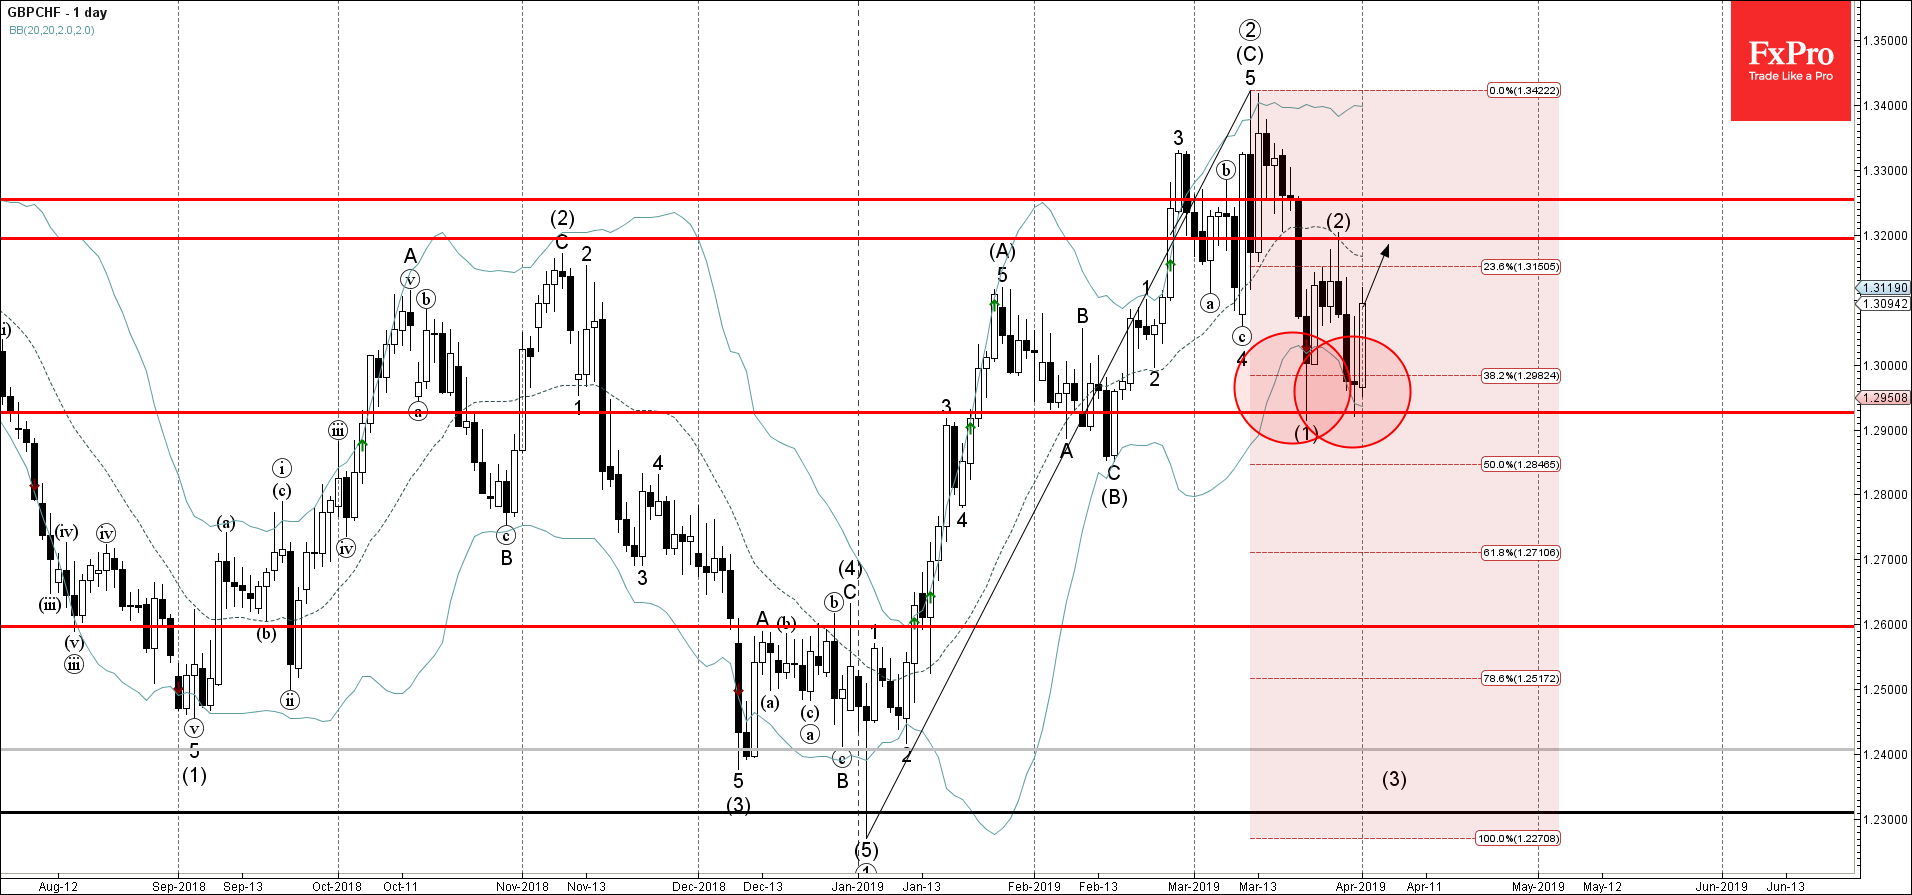
GBPCHF today reversed up from the support area lying between the key support level 1.2920 (monthly low from March), lower daily Bollinger Band and the 38.2% Fibonacci correction of the previous upward impulse wave from January.

The upward reversal from this support area is likely to create the daily Japanese candlesticks reversal pattern Morning Star.

GBPCHF is expected to rise further and re-test the next resistance level 1.3200 (top of the previous wave (2) from March).

GBPCHF

AddThis Website Tools
The FxPro Tech Analysis Team

The FxPro technical experts prepare a daily analysis of the most active currency pairs (majors, crosses, exotics) and commodities. Selected instruments are reviewed on daily trends (D1, H4), using the active Elliott Wave setups, Japanese candlesticks, indicators, and support/resistance levels.

Share
Published by
The FxPro Tech Analysis Team
Tags: GBPCHF

Recent Posts

Pfizer Wave Analysis – 27 March 2025

Pfizer: ⬇️ Sell - Pfizer broke support level 25.20 - Likely to fall to support level…

6 hours ago

Silver Wave Analysis – 27 March 2025

Silver: ⬆️ Buy - Silver broke resistance area - Likely to rise to resistance level…

6 hours ago

EURGBP Wave Analysis – 27 March 2025

EURGBP: ⬇️ Sell - EURGBP broke support area - Likely to fall to support level…

11 hours ago

3M Wave Analysis – 27 March 2025

3M: ⬇️ Sell - 3M reversed from resistance area - Likely to fall to support…

11 hours ago

Smashed Hopes for US Stocks Recovery

The US stock market faced resistance from new auto tariffs and concerns about global response,…

13 hours ago

Gold and Silver about to break the ceiling

Gold has experienced growth, reaching historical highs due to new tariff wars. Silver has also…

15 hours ago