Categories: Technical analysis

GBPCHF reversed from support area

  • GBPCHF reversed from support area
  • Further gains are likely

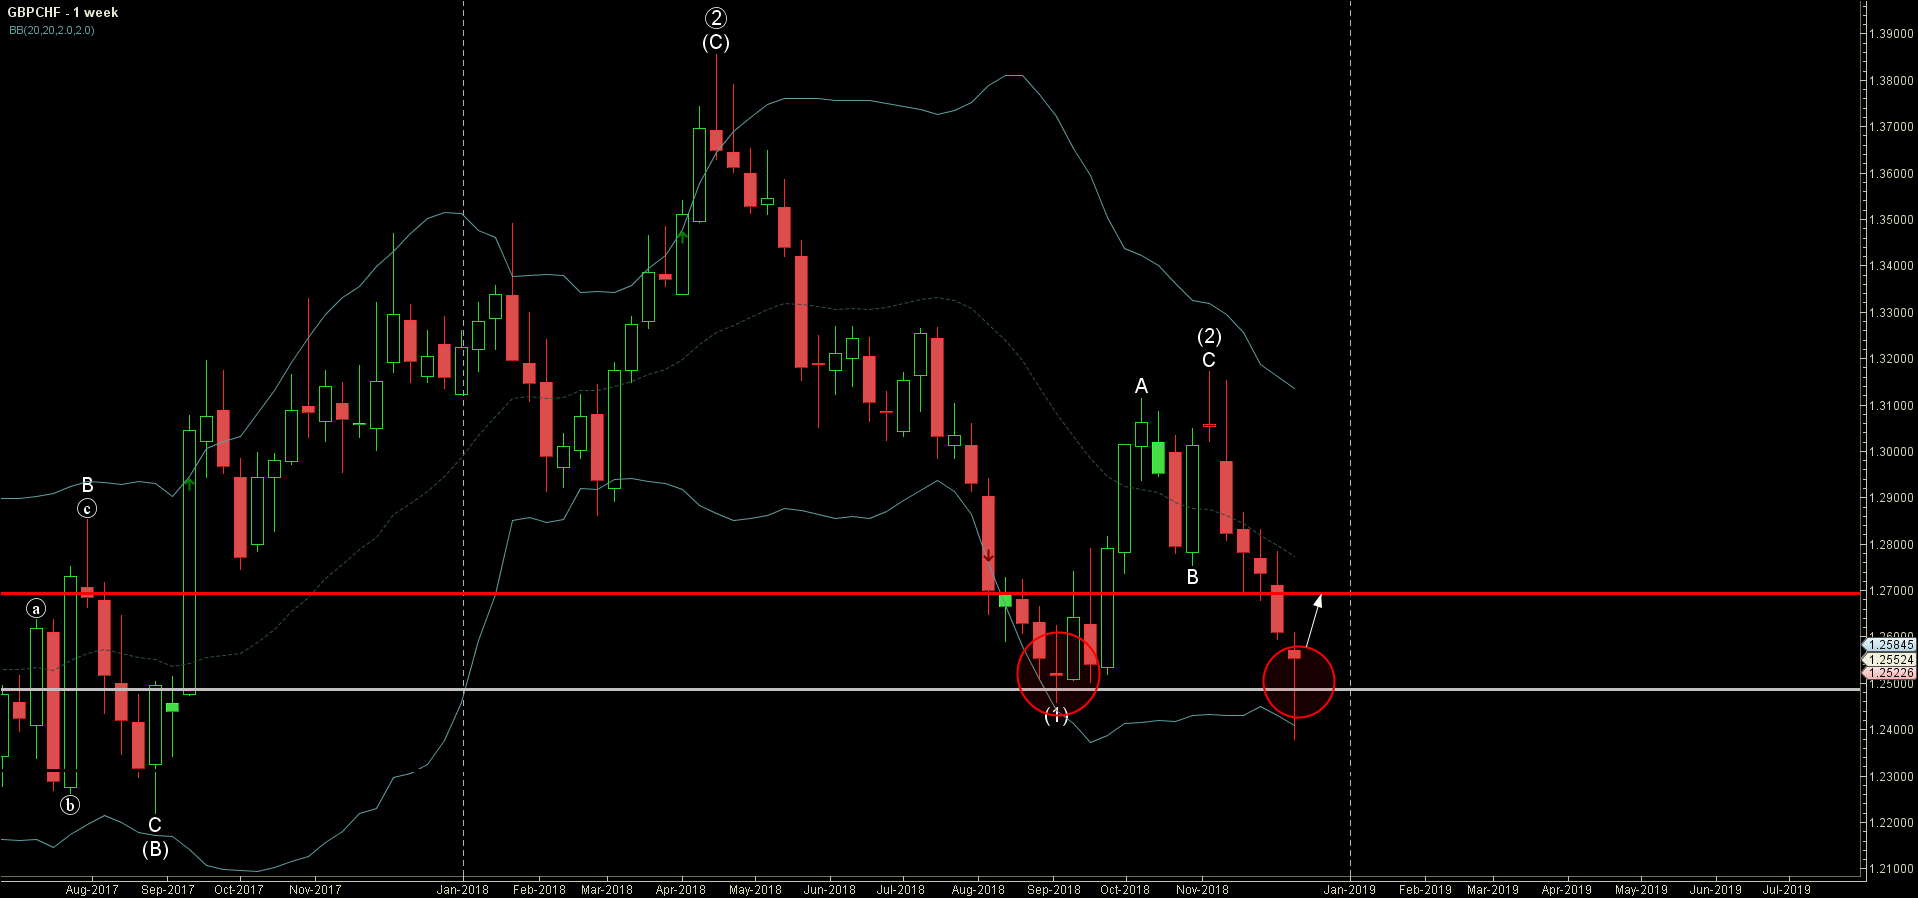
GBPCHF recently reversed up from the combined support area lying between the major support level 1.2500 (which stopped the previous impulse wave (1) with the daily Morning Star) and the lower weekly Bollinger Band.

If the price closes today near the active levels it will form the strong weekly Japanese candlesticks reversal pattern Hammer.

Given the strength of the nearby support level 1.2500 – GBPCHF is expected to rise further and re-test the next resistance level 1.2700.

The FxPro Tech Analysis Team

The FxPro technical experts prepare a daily analysis of the most active currency pairs (majors, crosses, exotics) and commodities. Selected instruments are reviewed on daily trends (D1, H4), using the active Elliott Wave setups, Japanese candlesticks, indicators, and support/resistance levels.

Share
Published by
The FxPro Tech Analysis Team
Tags: GBPCHF

Recent Posts

Nikkei 225 Wave Analysis – 4 April 2025

Nikkei 225: ⬇️ Sell - Nikkei 225 broke support zone - Likely to fall to…

2 days ago

Gold Wave Analysis – 4 April 2025

Gold: ⬇️ Sell - Gold broke daily up channel - Likely to fall to support…

2 days ago

Video Pro News Weekly

The U.S. dollar takes a major hit as trade tariffs spark capital flight, while global…

2 days ago

Mad Gold and Crude Oil

Gold experienced a significant increase followed by a sharp decline. It may be a good…

2 days ago

The US index’s demise has accelerated after confirming the downtrend

US indices fell after tough tariffs were announced by Trump, triggering a negative reaction in…

2 days ago

Tariff wars made the dollar a risky asset

The US dollar is experiencing a decline due to trade tariffs and capital flight. The…

2 days ago

This website uses cookies