Categories: Technical analysis

GBPCAD Wave Analysis 7 September 2023

– GBPCAD reversed from key support level 1.7025

– Likely to rise to resistance level 1.7300

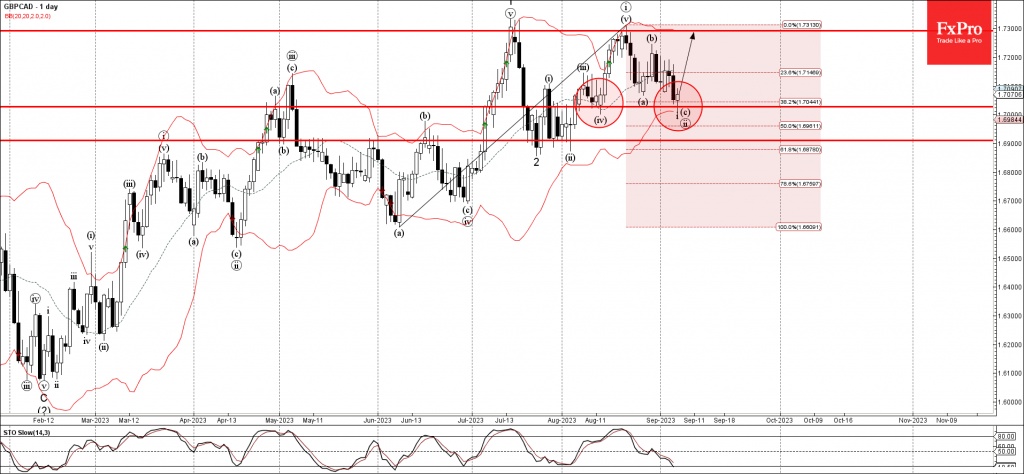
GBPCAD currency pair recently reversed up from the key support level 1.7025 (low of the previous minor correction iv), intersecting with the lower daily Bollinger Band.

The support level 1.7025 was strengthened by the 38.2% Fibonacci correction of the previous sharp upward impulse from June.

Given the clear daily uptrend, GBPCAD can be expected to rise toward the next resistance level 1.7300 (which reversed the previous waves 1 and i).

The FxPro Tech Analysis Team

The FxPro technical experts prepare a daily analysis of the most active currency pairs (majors, crosses, exotics) and commodities. Selected instruments are reviewed on daily trends (D1, H4), using the active Elliott Wave setups, Japanese candlesticks, indicators, and support/resistance levels.

Share
Published by
The FxPro Tech Analysis Team
Tags: GBPCAD

Recent Posts

USDJPY. Current situation #tradelikeapro #tradingstrategy #trandingshorts #usdjpy #usdjpytoday

Today is Monday, December 15th, and we're going to talk about the Japanese yen, where…

2 hours ago

ECB, BoE, and BoJ take different paths

Trump pushes for more Fed rate cuts, while no changes are expected from the ECB…

4 hours ago

Crypto Market Holds at $3T Amid Broken Uptrend

Crypto market stays near $3T amid correction, ETF inflows rise, sentiment weakens, and volatility expected…

5 hours ago

Gold Wave Analysis – 12 December 2025

Gold: ⬇️ Sell - Gold reversed from strong resistance level 4350.00 - Likely to fall to…

3 days ago

EURGBP Wave Analysis – 12 December 2025

EURGBP: ⬆️ Buy - EURGBP reversed from support zone - Likely to rise to resistance level…

3 days ago

Filecoin Wave Analysis – 12 December 2025

Filecoin: ⬇️ Sell - Filecoin broke key support level 1.435 - Likely to fall to support…

3 days ago

This website uses cookies